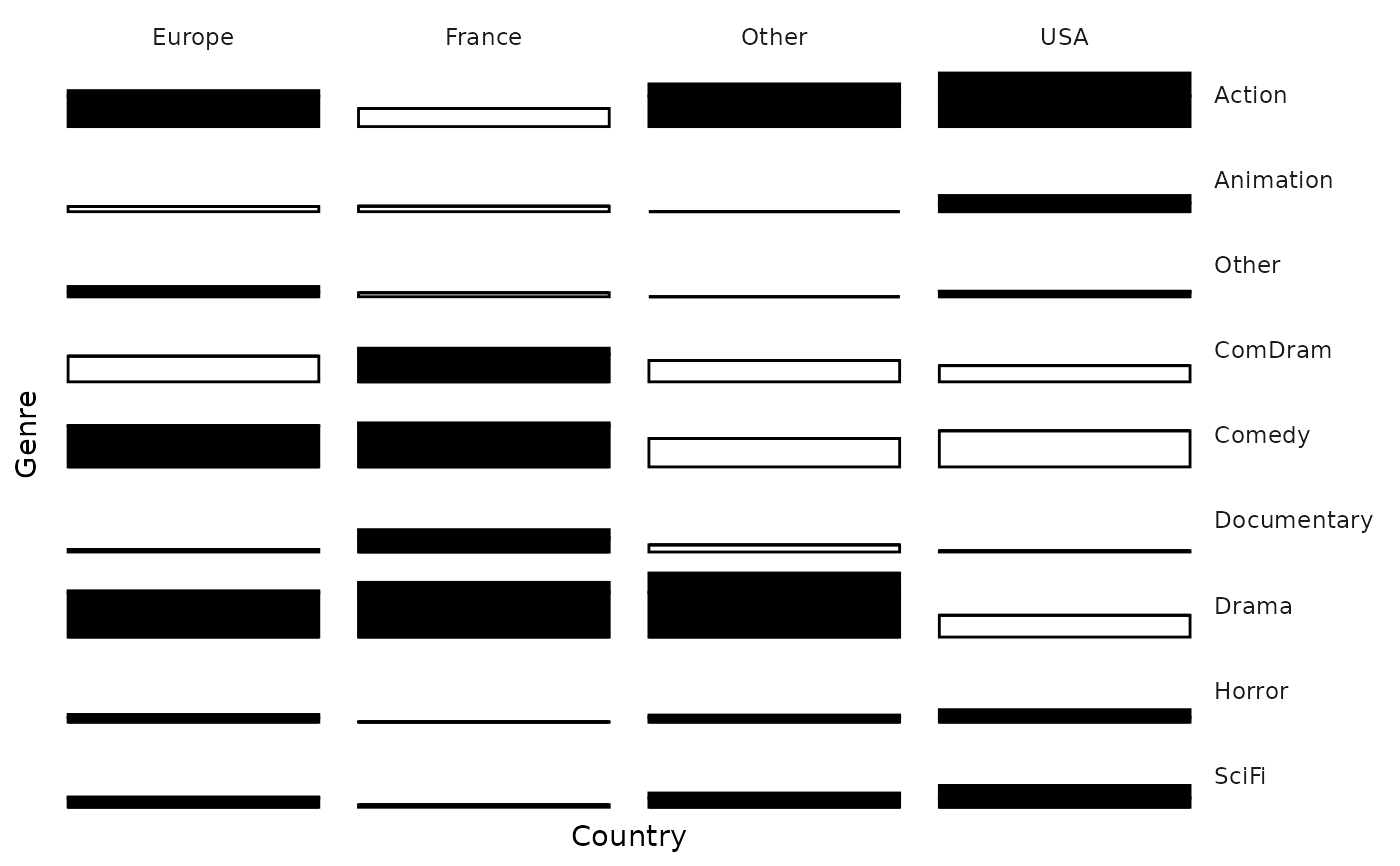
Bar plot of a crosstabulation inspired by Bertin
ggassoc_bertin.RdFor a cross-tabulation, plots bars for the conditional percentages of variable y according to variable x, using ggplot2. The general display is inspired by Bertin's plots.
ggassoc_bertin(data, mapping, prop.width = FALSE,
sort = "none", add.gray = FALSE, add.rprop = FALSE,
na.rm = FALSE, na.value ="NAs")
Arguments
- data
dataset to use for plot
- mapping
aesthetics being used. x and y are required, weight can also be specified.
- prop.width
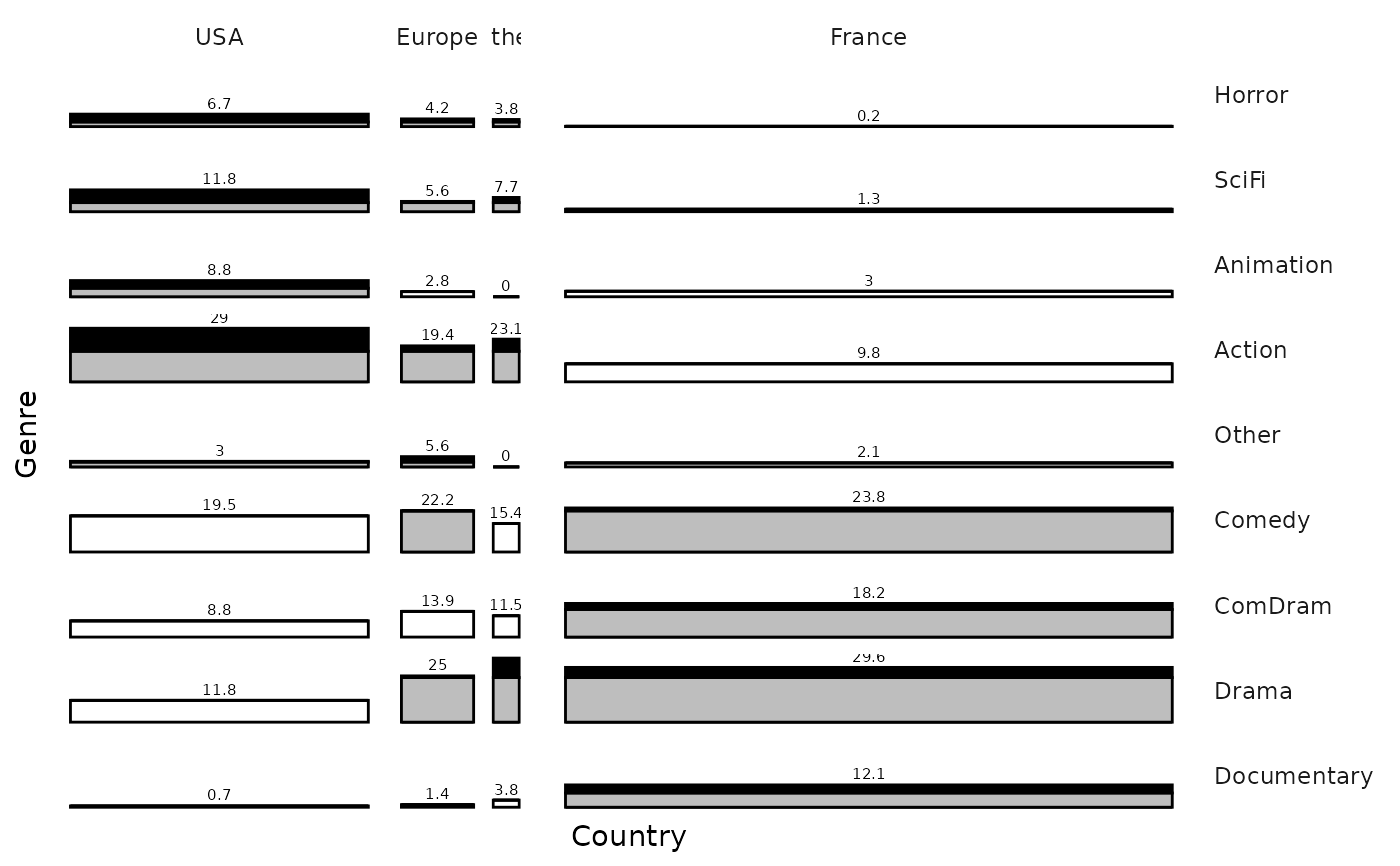
logical. If TRUE, the width of the bars is proportional to the margin percentages of variable x.
- sort
character. If "both", rows and columns are sorted according to the first factor of a correspondence analysis of the contingency table. If "x", only variable x is sorted. If "y", only variable y is sorted. If "none" (default), no sorting is done.
- add.gray
logical. If FALSE (default), only white and black are used to fill the bars. If TRUE, gray is used additionally to fill the part of the bars corresponding to margin percentages of variable y.
- add.rprop
logical. If TRUE, row percentages are displayed on top of the bars. Default is FALSE.
- na.rm
logical, indicating whether NA values should be silently removed before the computation proceeds. If FALSE (default), an additional level is added to the variables (see na.value argument).
- na.value
character. Name of the level for NA category. Default is "NAs". Only used if na.rm = FALSE.
Details
The height of the bars is proportional to the conditional frequency of variable y. The bars are filled in black if the conditional frequency is higher than the marginal frequency; otherwise it's filled in white.
This graphical representation is inspired by the principles of Jacques Bertin and the online AMADO tool (https://paris-timemachine.huma-num.fr/amado/main.html).
Note : It does not allow faceting.
Value
a ggplot object
References
J. Bertin: La graphique et le traitement graphique de l'information. Flammarion: Paris 1977.