Plots counts and associations of a crosstabulation
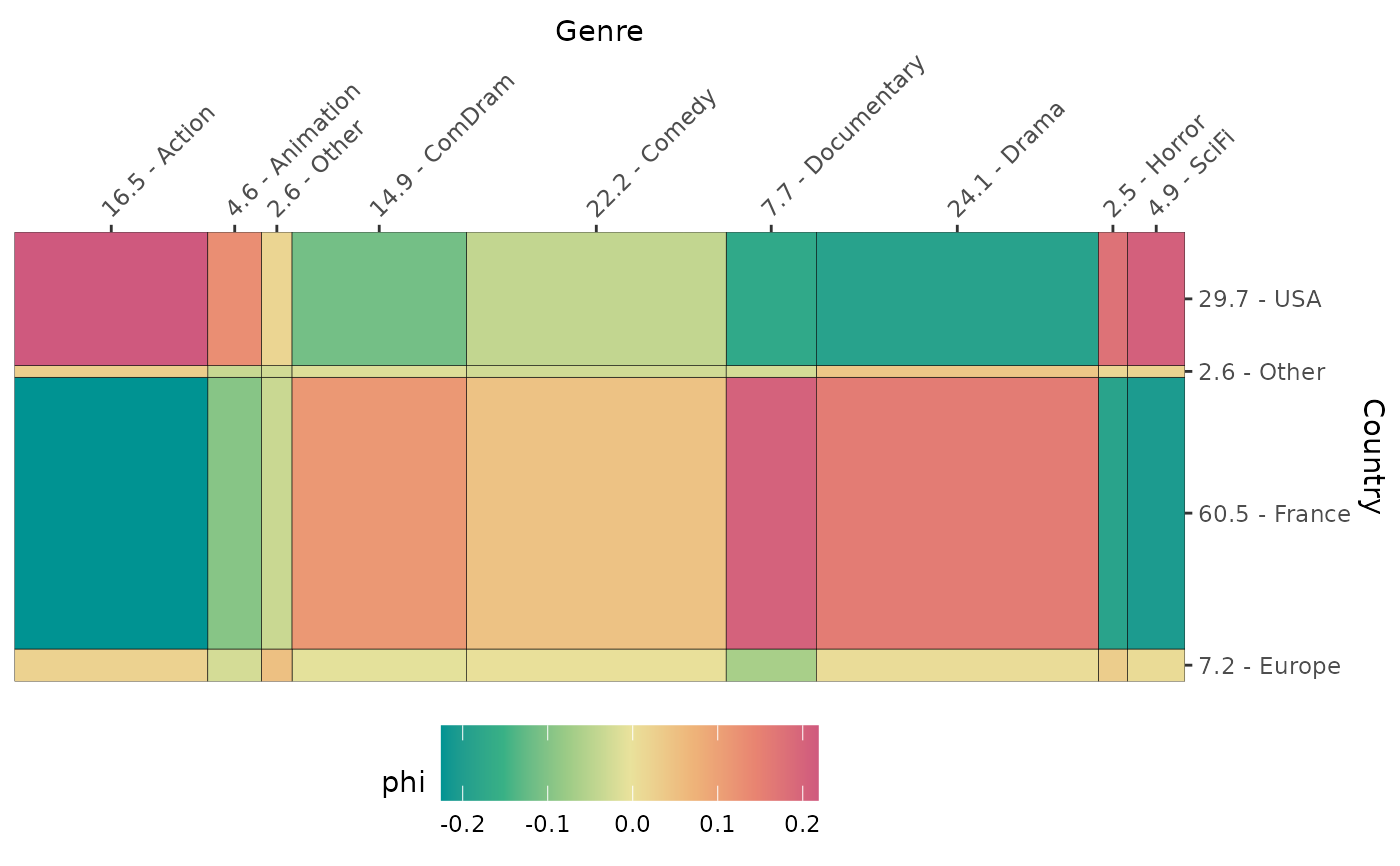
ggassoc_chiasmogram.RdFor a cross-tabulation, plots the number of observations by using rectangles with proportional areas, and the phi measures of association between the categories with a diverging gradient of colour, using ggplot2.
ggassoc_chiasmogram(data, mapping, measure = "phi",
limits = NULL, sort = "none",
na.rm = FALSE, na.value = "NAs",
colors = NULL, direction = 1)
Arguments
- data
dataset to use for plot
- mapping
aesthetics being used. x and y are required, weight can also be specified.
- measure
character. The measure of association used for filling the rectangles. Can be "phi" for phi coefficient (default), "or" for odds ratios, "residuals" for Pearson residuals, "std.residuals" for standardized Pearson residuals or "pem" for local percentages of maximum deviation from independence.
- limits
a numeric vector of length two providing limits of the scale. If NULL (default), the limits are automatically adjusted to the data.
- sort
character. If "both", rows and columns are sorted according to the first factor of a correspondence analysis of the contingency table. If "x", only rows are sorted. If "y", only columns are sorted. If "none" (default), no sorting is done.
- na.rm
logical, indicating whether NA values should be silently removed before the computation proceeds. If FALSE (default), an additional level is added to the variables (see na.value argument).
- na.value
character. Name of the level for NA category. Default is "NAs". Only used if na.rm = FALSE.
- colors
vector of colors that will be interpolated to produce a color gradient. If NULL (default), the "Temps" palette from
rcartocolorspackage is used.- direction
Sets the order of colours in the scale. If 1, the default, colours are as output by RColorBrewer::brewer.pal(). If -1, the order of colours is reversed.
Details
The height of the rectangles is proportional to the marginal frequency of the row variable ; their width is proportional to the marginal frequency of the column variable. So the area of the rectangles is proportional to the expected frequency.
The rectangles are filled according to a measure of local association, which measures how much each combination of categories of x and y is over/under-represented.
This function can be used as a high-level plot with ggduo and ggpairs functions of the GGally package.
Note : It does not allow faceting.
Value
a ggplot object
References
Bozon Michel, Héran François. La découverte du conjoint. II. Les scènes de rencontre dans l'espace social. Population, 43(1), 1988, pp. 121-150.