Confidence ellipses
ggadd_ellipses.RdAdds confidence ellipses for a categorical variable to a MCA cloud of individuals
Arguments
- p
ggplot2object with the cloud of individuals- resmca
object created with
MCA,speMCA,csMCA,wcMCA,bcMCA,stMCAormultiMCAfunction- var
Factor. The categorical variable used to plot ellipses.
- sel
numeric vector of indexes of the categories to plot (by default, ellipses are plotted for every categories)
- axes
numeric vector of length 2, specifying the components (axes) to plot. Default is c(1,2).
- level
The level at which to draw an ellipse (see
stat_ellipse). Default is 0.05, which means 95 percents confidence ellipses are plotted.- label
Logical. Should the labels of the categories be plotted at the center of ellipses ? Default is TRUE.
- label.size
Size of the labels of the categories at the center of ellipses. Default is 3.
- size
Size of the lines of the ellipses. Default is 0.5.
- points
If TRUE (default), the points are coloured according to their subcloud.
- legend
the position of legends ("none", "left", "right", "bottom", "top", or two-element numeric vector). Default is right.
Value
a ggplot2 object
Details
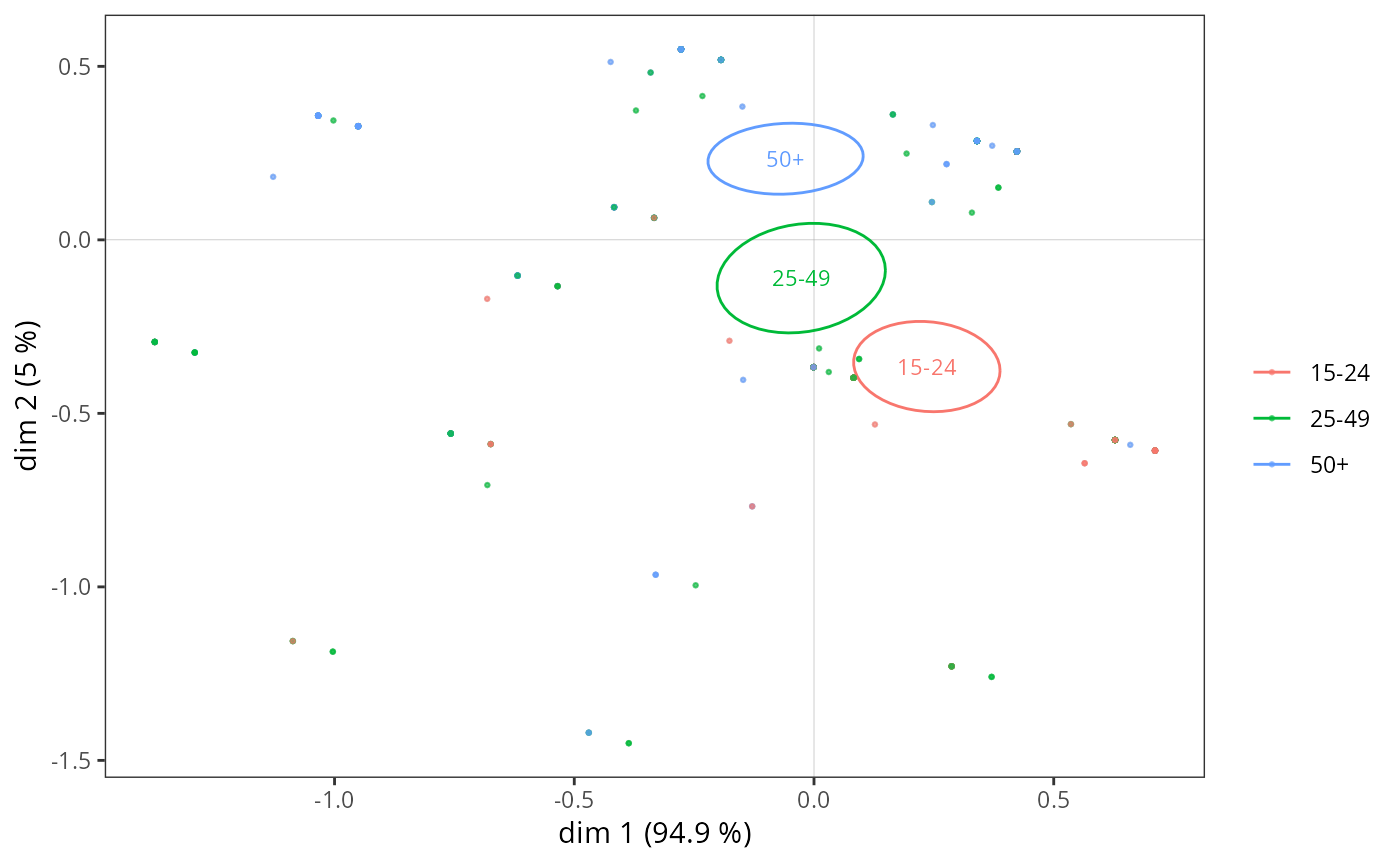
A confidence ellipse aims at measuring how the "true" mean point of a category differs from its observed mean point. This is achieved by constructing a confidence zone around the observed mean point. If we choose a conventional level alpha (e.g. 0.05), a (1 - alpha) (e.g. 95 percents) confidence zone is defined as the set of possible mean points that are not significantly different from the observed mean point.
Note
Ellipses are colored according to the categories of the variable, using the default ggplot2 palette. The palette can be customized using any scale_color_* function, such as scale_color_brewer(), scale_color_grey() or scale_color_manual().
References
Le Roux B. and Rouanet H., Multiple Correspondence Analysis, SAGE, Series: Quantitative Applications in the Social Sciences, Volume 163, CA:Thousand Oaks (2010).
Le Roux B. and Rouanet H., Geometric Data Analysis: From Correspondence Analysis to Stuctured Data Analysis, Kluwer Academic Publishers, Dordrecht (June 2004).
See also
Examples
# specific MCA of Music example data set
data(Music)
junk <- c("FrenchPop.NA", "Rap.NA", "Rock.NA", "Jazz.NA", "Classical.NA")
mca <- speMCA(Music[,1:5], excl = junk)
# confidence ellipses for Age
p <- ggcloud_indiv(mca, col = "lightgrey")
ggadd_ellipses(p, mca, Music$Age)