Plot of categorical supplementary variables
ggadd_supvars.RdAdds categorical supplementary variables to a MCA cloud of variables.
ggadd_supvars(p, resmca, vars, excl = NULL, points = "all", min.cos2 = 0.1,
axes = c(1,2), col = NULL,
shapes = FALSE, prop = NULL, textsize = 3, shapesize = 6,
vlab = TRUE, vname = NULL,
force = 1, max.overlaps = Inf)
Arguments
- p
ggplot2object with the cloud of variables- resmca
object created with
MCA,speMCA,csMCA,wcMCA,bcMCA,stMCAormultiMCAfunction- vars
A data frame of categorical supplementary variables. All these variables should be factors.
- excl
character vector of supplementary categories to exclude from the plot, specified in the form "namevariable.namecategory" (for instance "Gender.Men"). If NULL (default), all the supplementary categories are plotted.
- points
character string. If 'all' all categories are plotted (default); if 'besth' only those with a minimum squared cosine on horizontal axis are plotted; if 'bestv' only those with a minimum squared cosine on vertical axis are plotted; if 'besthv' only those with a minimum squared cosine on horizontal or vertical axis are plotted; if 'best' only those with a minimum squared cosine on the plane are plotted.
- min.cos2
numerical value. The minimal squared cosine if 'points' argument is different from 'all'. Default
- axes
numeric vector of length 2, specifying the components (axes) to plot. Default is c(1,2).
- col
character string. Color name for the labels (and the shapes if
shapes=TRUE) of the categories. If NULL, the default palette ofggplot2is used, with one color per variable.- shapes
Logical. If TRUE, symbols are used in addition to the labels of categories. Default is FALSE.
- prop
If NULL, the size of the labels (if
shapes=FALSE), or of the labels and the shapes (ifshapes=TRUE) is constant. If 'n', the size is proportional the the weights of categories; if 'vtest1', the size is proportional to the test values of the categories on the first dimension of the plot; if 'vtest2', the size is proportional to the test values of the categories on the second dimension of the plot; if 'cos1', the size is proportional to the cosines of the categories on the first dimension of the plot; if 'cos2', the size is proportional to the cosines of the categories on the second dimension of the plot; if 'cos12', the size is proportional to the total cosines of the categories on the two dimensions of the plot.- textsize
Size of the labels of categories if
shapesis TRUE, or ifshapesis FALSE andpropis NULL. Default is 3.- shapesize
Size of the shapes if
prop=NULL, maximum size of the shapes in other cases. Default is 6.- vlab
Logical. If TRUE (default), the variable name is added as a prefix for the labels of the categories.
- vname
deprecated, use vlab instead
- force
Force of repulsion between overlapping text labels. Defaults to 1. If 0, labels are not repelled at all.
- max.overlaps
Exclude text labels that overlap too many things. Defaults to Inf, which means no labels are excluded.
Value
a ggplot2 object
Note
Shapes and labels are colored according to the categories of the variable, using the default ggplot2 palette. The palette can be customized using any scale_color_* function, such as scale_color_brewer(), scale_color_grey() or scale_color_manual().
References
Le Roux B. and Rouanet H., Multiple Correspondence Analysis, SAGE, Series: Quantitative Applications in the Social Sciences, Volume 163, CA:Thousand Oaks (2010).
Le Roux B. and Rouanet H., Geometric Data Analysis: From Correspondence Analysis to Stuctured Data Analysis, Kluwer Academic Publishers, Dordrecht (June 2004).
See also
Examples
# specific MCA of Music example data set
data(Music)
junk <- c("FrenchPop.NA", "Rap.NA", "Rock.NA", "Jazz.NA", "Classical.NA")
mca <- speMCA(Music[,1:5], excl = junk)
# adds several supplementary variables
# onto the cloud of variables
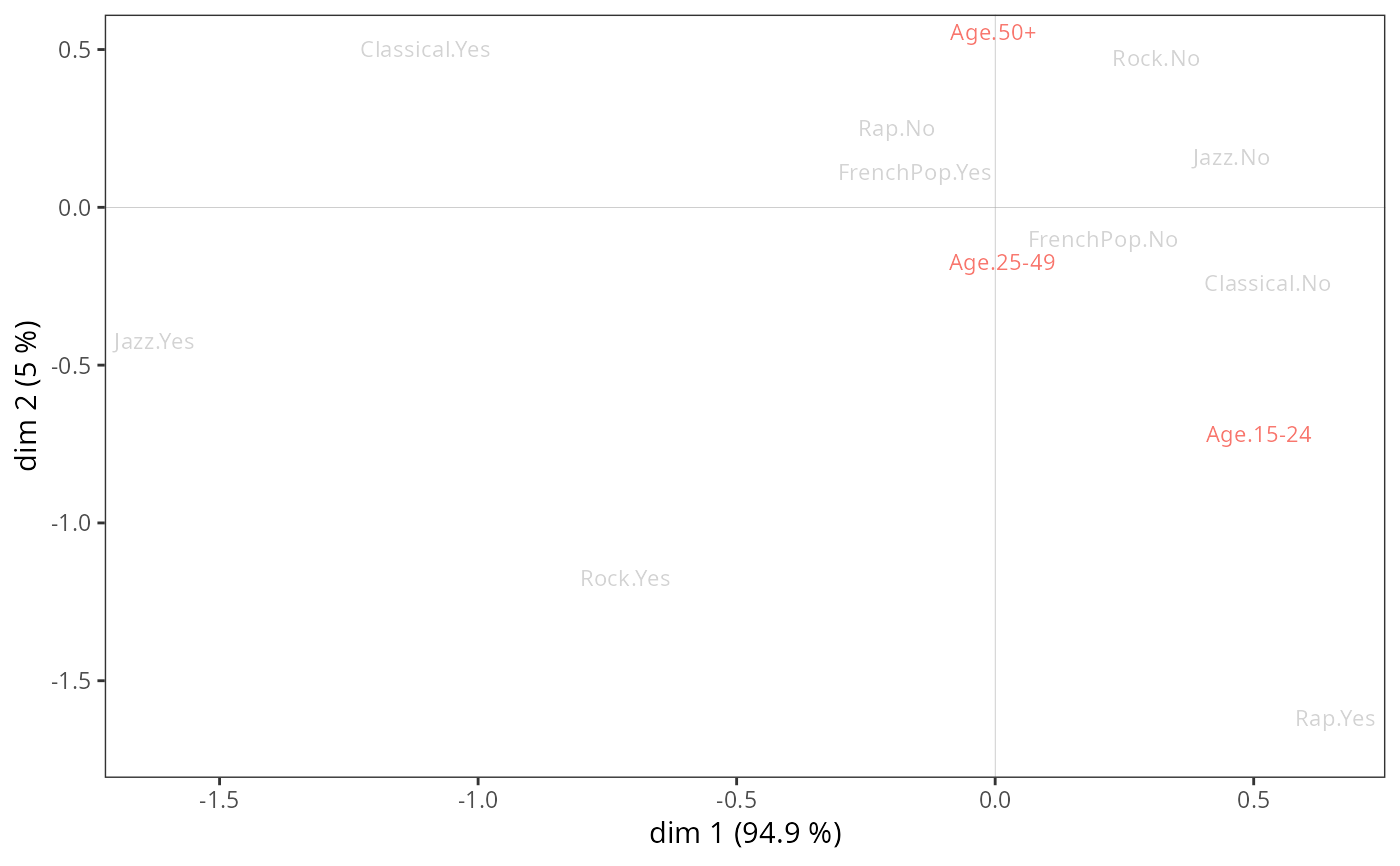
p <- ggcloud_variables(mca, col = "lightgrey", shapes = FALSE)
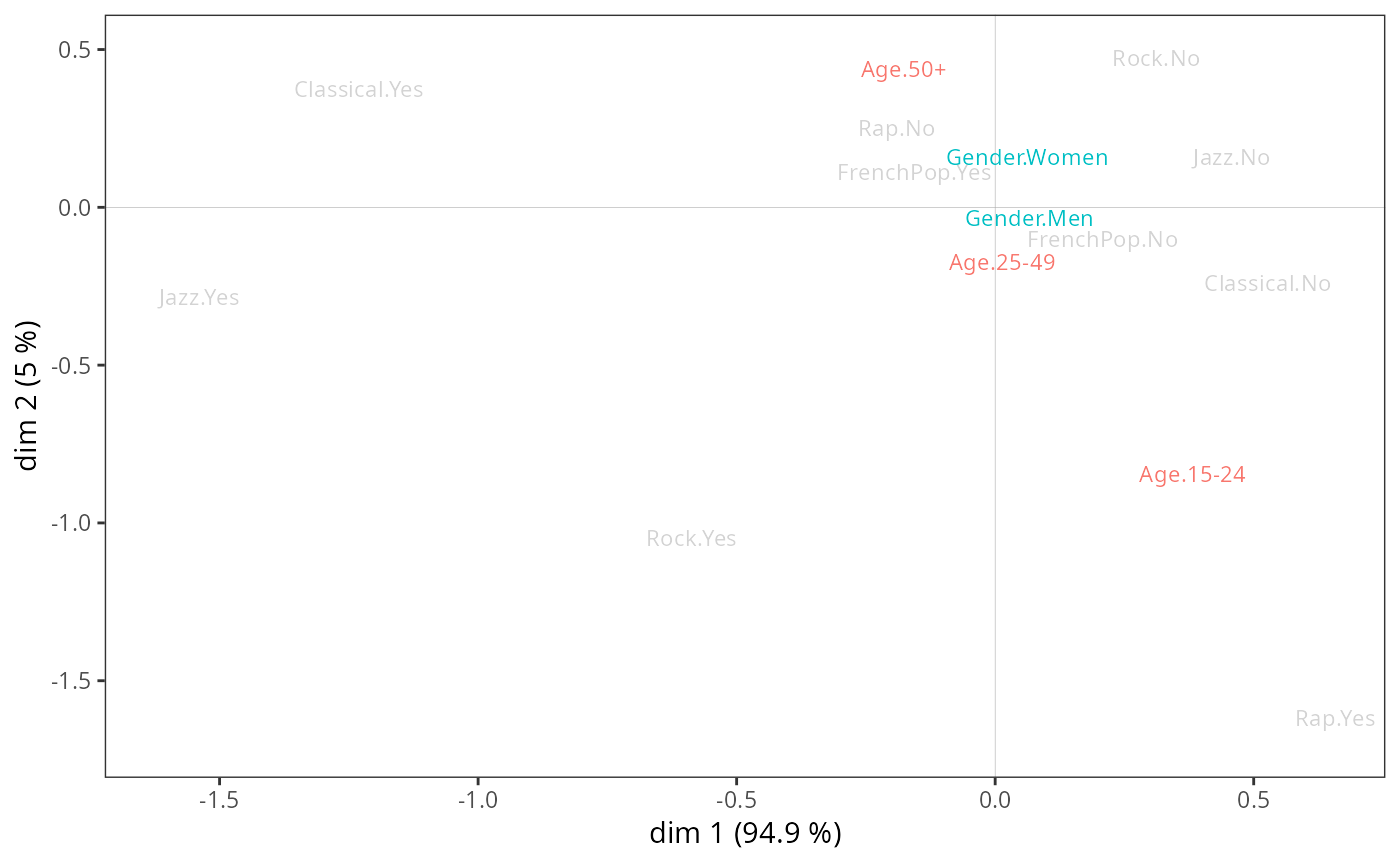
ggadd_supvars(p, mca, Music[, c("Gender","Age")])
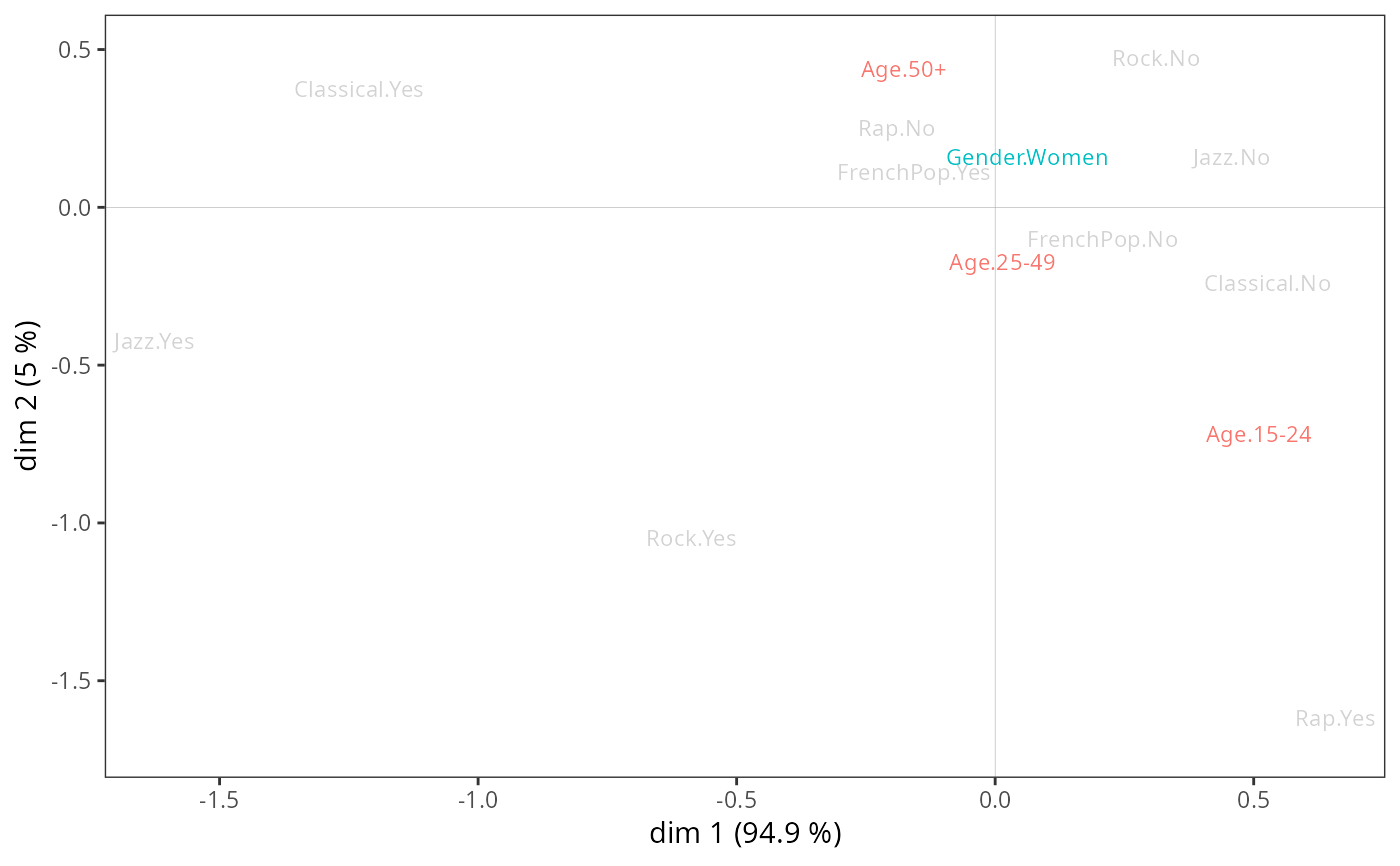
 # the same, excluding men
ggadd_supvars(p, mca, Music[, c("Gender","Age")], excl = "Gender.Men")
# the same, excluding men
ggadd_supvars(p, mca, Music[, c("Gender","Age")], excl = "Gender.Men")
 # the same, keeping only categories
# with cos2 >= 0.001 for dimension 1
ggadd_supvars(p, mca, Music[, c("Gender","Age")], points = "besth", min.cos2 = 0.001)
# the same, keeping only categories
# with cos2 >= 0.001 for dimension 1
ggadd_supvars(p, mca, Music[, c("Gender","Age")], points = "besth", min.cos2 = 0.001)