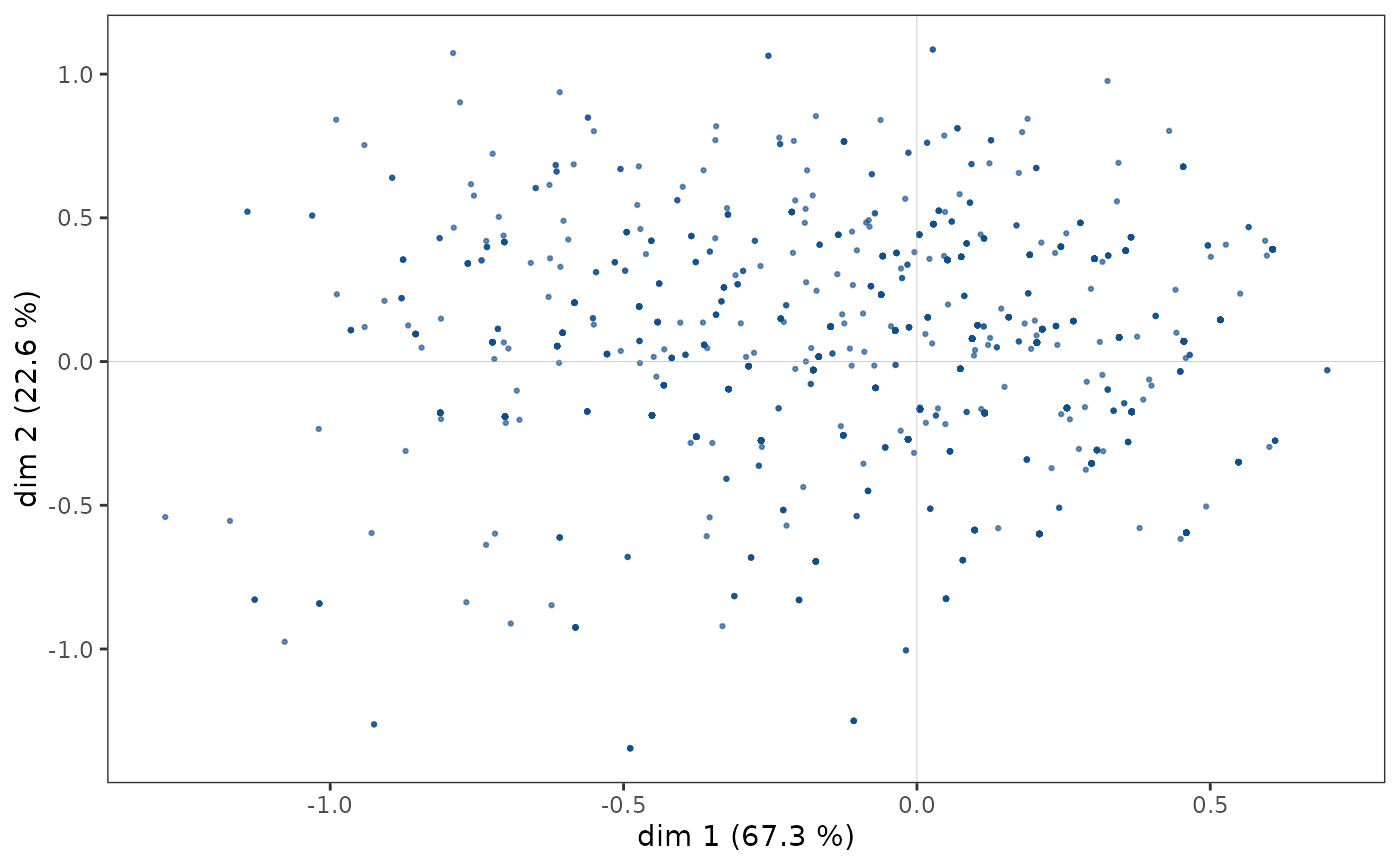
Plot of the cloud of individuals
ggcloud_indiv.RdPlots a Multiple Correspondence Analysis cloud of individuals.
ggcloud_indiv(resmca, type = "i", points = "all", axes = c(1,2),
col = "dodgerblue4", point.size = 0.5, alpha = 0.6,
repel = FALSE, text.size = 2,
density = NULL, col.contour = "darkred", hex.bins = 50, hex.pal = "viridis")
Arguments
- resmca
object created with
MCA,speMCA,csMCA,wcMCA,bcMCA,stMCAormultiMCAfunction- type
If 'i', points are plotted. If 'inames', labels of individuals are plotted.
- points
character string. If 'all' all points are plotted (default). If 'besth' only those who contribute most to horizontal axis are plotted. If 'bestv' only those who contribute most to vertical axis are plotted. If 'besthv' only those who contribute most to horizontal or vertical axis are plotted. If 'best' only those who contribute most to the plane are plotted.
- axes
numeric vector of length 2, specifying the components (axes) to plot. Default is c(1,2).
- col
If a factor, points or labels are colored according to their category regarding this factor. If a string with color name, every points or labels have the same color. Default is "dodgerblue4".
- point.size
Size of the points of individuals. Default is 0.5.
- alpha
Transparency of the points or labels of individuals. Default is 0.6.
- repel
Logical. When
type="inames"", should labels of individuals be repeled ? Default is FALSE.- text.size
Size of the labels of individuals. Default is 2.
- density
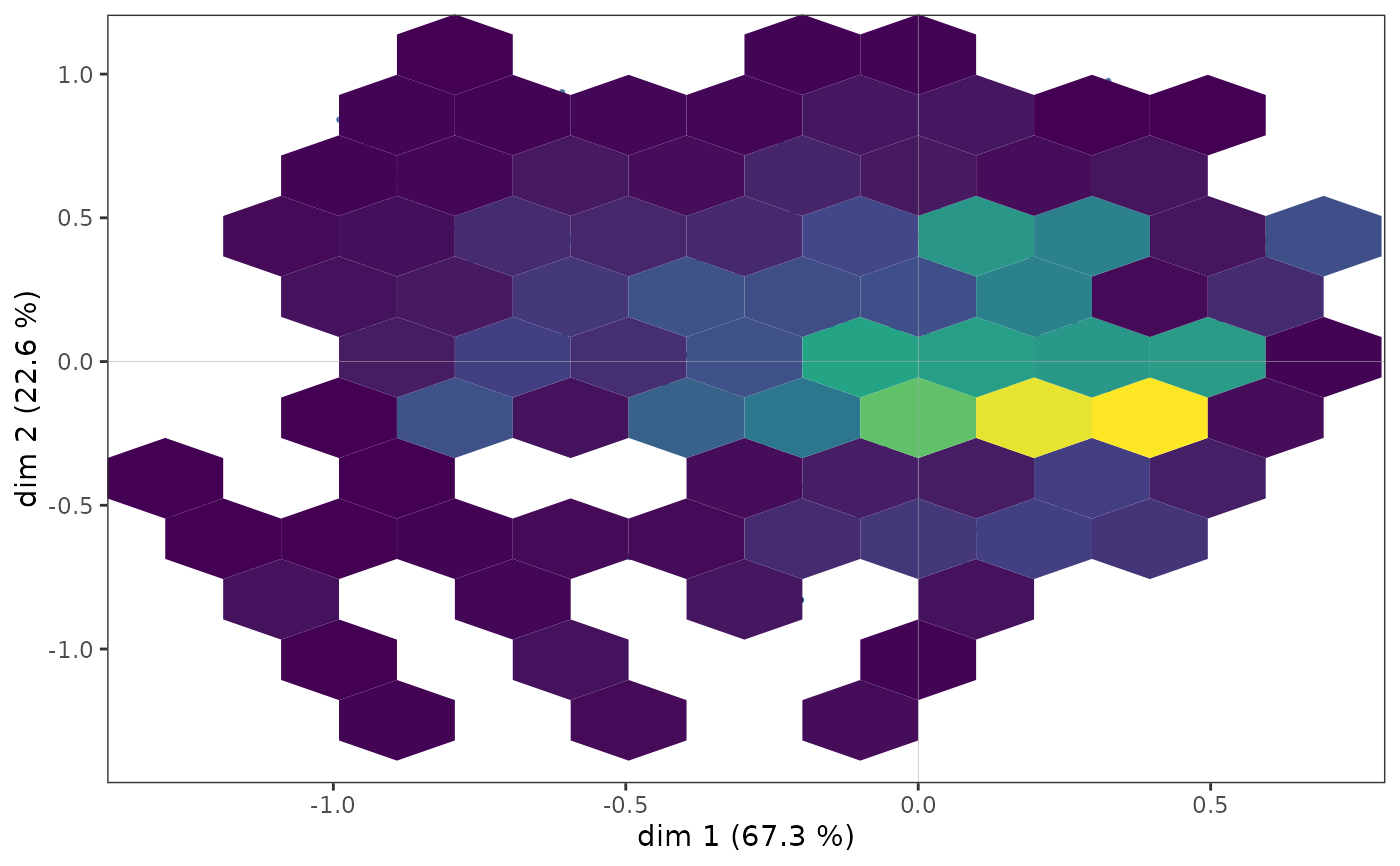
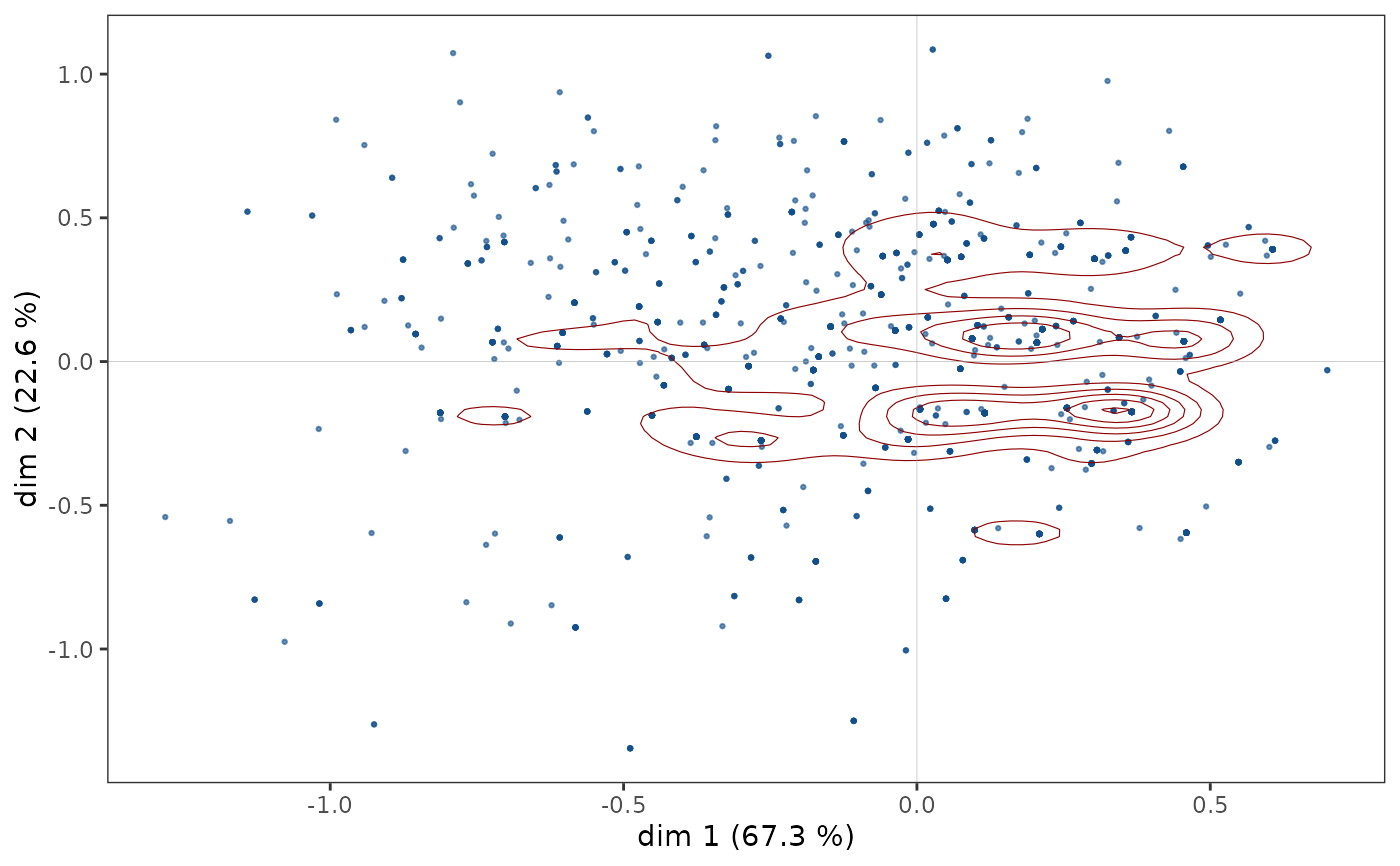
If NULL (default), no density layer is added. If "contour", density is plotted with contours. If "hex", density is plotted with hexagon bins.
- col.contour
character string. The color of the contours. Only used if density="contour".
- hex.bins
integer. The number of bins in both vertical and horizontal directions. Only used if
density="hex".- hex.pal
character string. The name of a viridis palette for hexagon bins. Only used if
density="hex".
Value
a ggplot2 object
Details
Sometimes the dots are too many and overlap. It is then difficult to get an accurate idea of the distribution of the cloud of individuals. The density argument allows you to add an additional layer to represent the density of points in the plane, in the form of contours or hexagonal areas.
Note
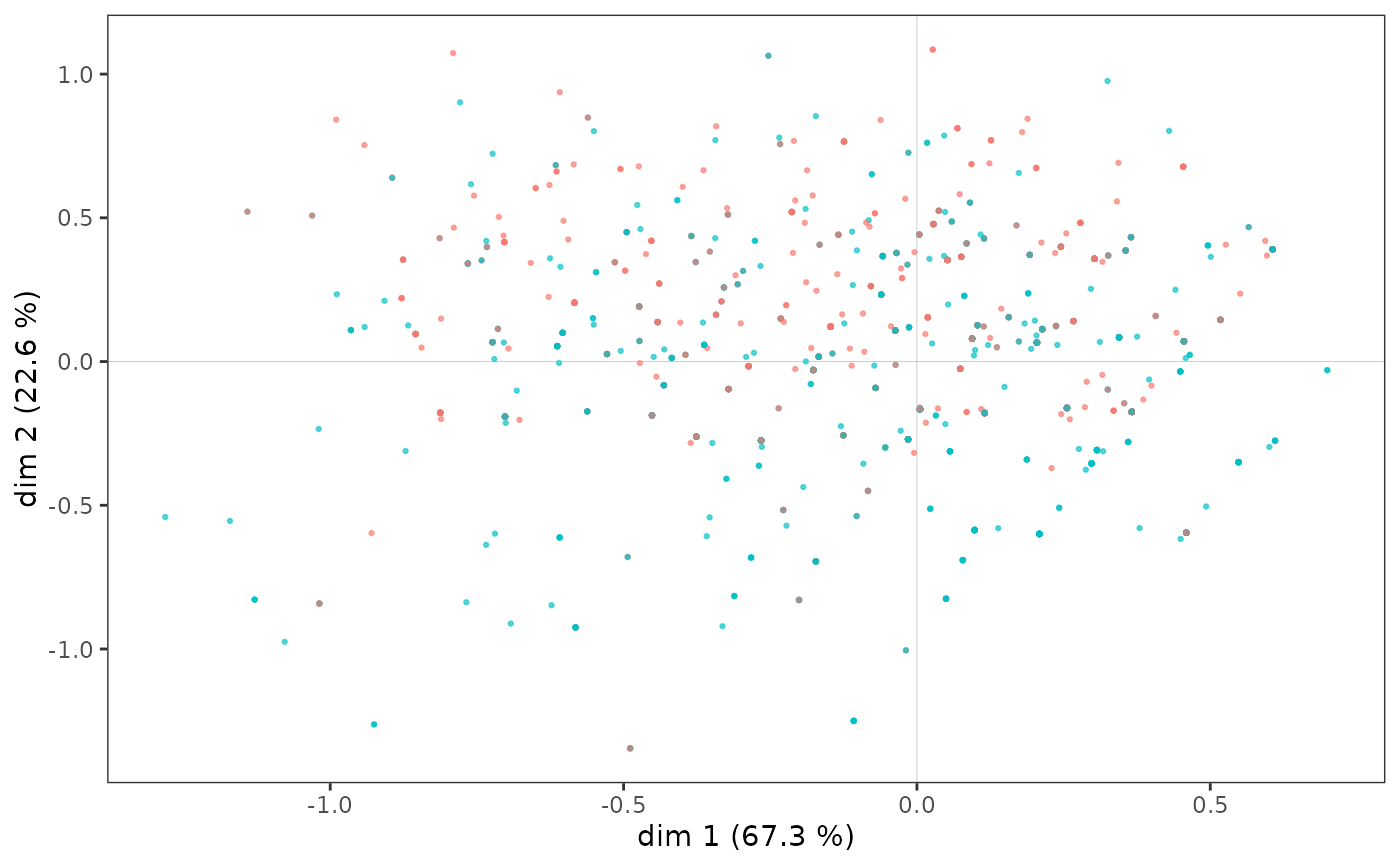
If col argument is a factor, points or labels are colored according to the categories of the factor, using the default ggplot2 palette. The palette can be customized using any scale_color_* function, such as scale_color_brewer(), scale_color_grey() or scale_color_manual().
References
Le Roux B. and Rouanet H., Multiple Correspondence Analysis, SAGE, Series: Quantitative Applications in the Social Sciences, Volume 163, CA:Thousand Oaks (2010).
Le Roux B. and Rouanet H., Geometric Data Analysis: From Correspondence Analysis to Stuctured Data Analysis, Kluwer Academic Publishers, Dordrecht (June 2004).
See also
Examples
# specific MCA of Taste example data set
data(Taste)
junk <- c("FrenchPop.NA", "Rap.NA", "Rock.NA", "Jazz.NA", "Classical.NA",
"Comedy.NA", "Crime.NA", "Animation.NA", "SciFi.NA", "Love.NA",
"Musical.NA")
mca <- speMCA(Taste[,1:11], excl = junk)
# cloud of individuals
ggcloud_indiv(mca)
 # points are colored according to gender
ggcloud_indiv(mca, col=Taste$Gender)
# points are colored according to gender
ggcloud_indiv(mca, col=Taste$Gender)
 # a density layer of contours is added
ggcloud_indiv(mca, density = "contour")
# a density layer of contours is added
ggcloud_indiv(mca, density = "contour")
 # a density layer of hexagon bins is added
ggcloud_indiv(mca, density = "hex", hex.bin = 10)
# a density layer of hexagon bins is added
ggcloud_indiv(mca, density = "hex", hex.bin = 10)