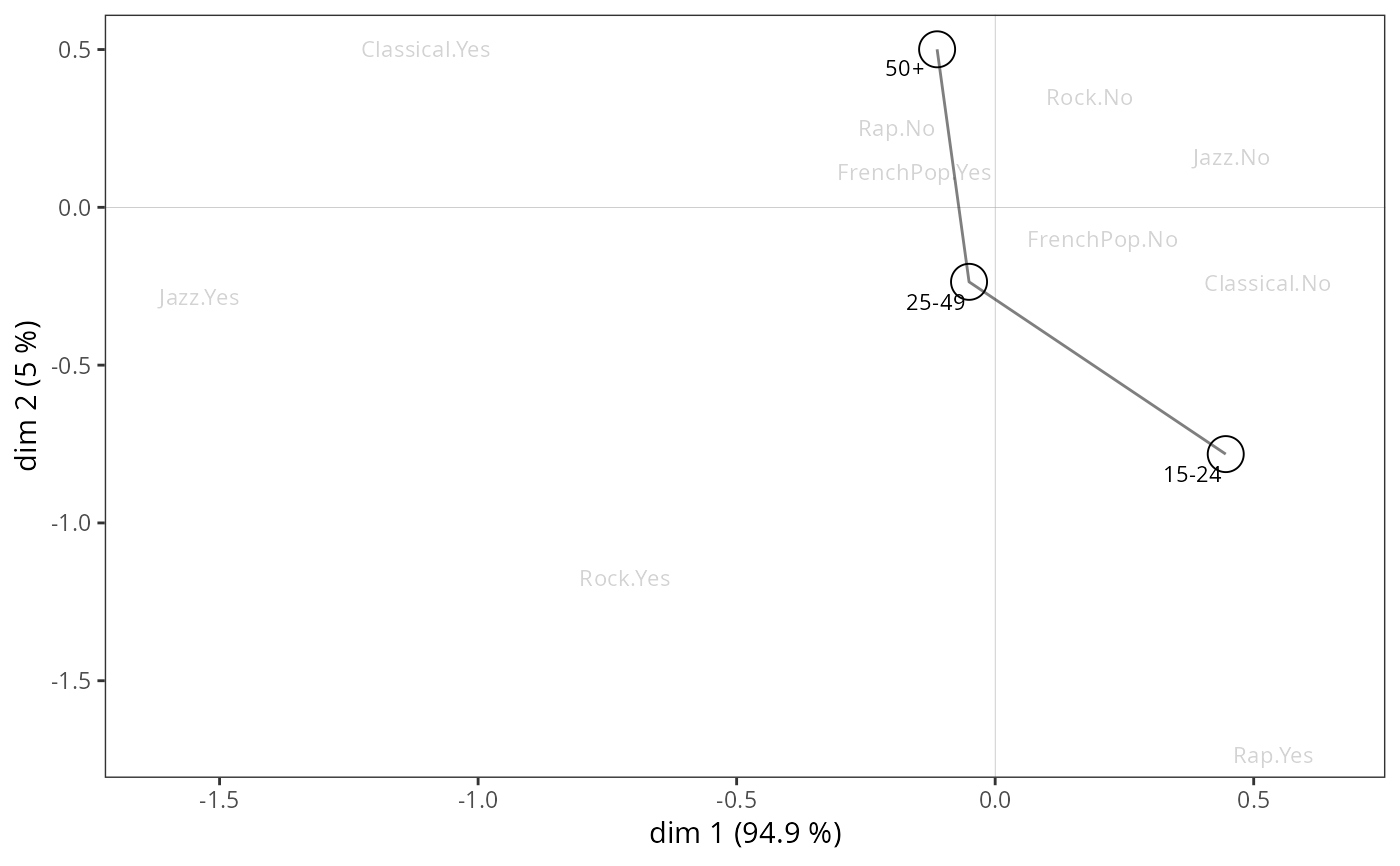
Plot of a categorical supplementary variable
ggadd_supvar.RdAdds a categorical supplementary variable to a MCA cloud of variables.
Arguments
- p
ggplot2object with the cloud of variables- resmca
object created with
MCA,speMCA,csMCA,wcMCA,bcMCA,stMCAormultiMCAfunction- var
Factor. The categorical supplementary variable. It does not need to have been used at the MCA step.
- sel
Numeric vector of indexes of the categories of the supplementary variable to be added to the plot. By default, labels are plotted for every categories.
- axes
numeric vector of length 2, specifying the components (axes) to plot. Default is c(1,2).
- col
Character. Color of the shapes and labels of the categories. Default is black.
- shape
Symbol to be used in addition the the labels of categories (default is 1). If NULL, only labels are plotted.
- prop
If NULL, the size of the labels (if shape=NULL) or the shapes (otherwise) is constant. If 'n', the size is proportional the the weights of categories; if 'vtest1', the size is proportional to the test values of the categories on the first dimension of the plot; if 'vtest2', the size is proportional to the test values of the categories on the second dimension of the plot; if 'cos1', the size is proportional to the cosines of the categories on the first dimension of the plot; if 'cos2', the size is proportional to the cosines of the categories on the second dimension of the plot; if 'cos12', the size is proportional to the total cosines of the categories on the two dimensions of the plot.
- textsize
Size of the labels of categories if shape is not NULL, or if shape=NULL and prop=NULL. Default is 3.
- shapesize
Size of the shapes if prop=NULL, maximum size of the shapes in other cases. Default is 6.
- segment
Logical. Should one add lines between categories ? Default is FALSE.
- vname
A character string to be used as a prefix for the labels of the categories. If NULL (default), no prefix is added.
Value
a ggplot2 object
References
Le Roux B. and Rouanet H., Multiple Correspondence Analysis, SAGE, Series: Quantitative Applications in the Social Sciences, Volume 163, CA:Thousand Oaks (2010).
Le Roux B. and Rouanet H., Geometric Data Analysis: From Correspondence Analysis to Stuctured Data Analysis, Kluwer Academic Publishers, Dordrecht (June 2004).
See also
Examples
# specific MCA of Music example data set
data(Music)
junk <- c("FrenchPop.NA", "Rap.NA", "Rock.NA", "Jazz.NA", "Classical.NA")
mca <- speMCA(Music[,1:5], excl = junk)
# adds Age as a supplementary variable
# onto the cloud of variables
p <- ggcloud_variables(mca, col = "lightgrey", shapes = FALSE)
ggadd_supvar(p, mca, Music$Age, segment = TRUE)