Concentration ellipses
conc.ellipse.RdAdds concentration ellipses or other kinds of inertia ellipses to the cloud of individuals of a MCA.
Arguments
- resmca
object of class
MCA,speMCA,csMCA,multiMCAorstMCA- var
supplementary variable to plot
- sel
numeric vector of indexes of the categories to plot (by default, ellipses are plotted for every categories)
- axes
length 2 vector specifying the components to plot (default is c(1,2))
- kappa
numeric. The kappa value (i.e. "index") of the inertia ellipses. By default, kappa = 2, which means that concentration ellipses are plotted.
- col
vector of colors for the ellipses of plotted categories (by default, rainbow palette is used)
- pcol
vector of colors for the points at the center of ellipses of plotted categories (by default, rainbow palette is used)
- pcex
numerical value giving the amount by which points at the center of ellipses should be magnified (default is 0.2)
- lty
line type for ellipses (default is 1)
- lwd
line width for the ellipses (default is 1)
- tcex
numerical value giving the amount by which labels at the center of ellipses should be magnified (default is 0.2)
- text.lab
whether the labels at the center of ellipses should be displayed (default is TRUE)
Details
If kappa=2, ellipses are called "concentration" ellipses and, for a normally shaped subcloud, contain 86.47 percents of the points of the subcloud. If kappa=1, ellipses are "indicator" ellipses and contain 39.35 percents of the points of the subcloud. If kappa=1.177, ellipses are "median" ellipses and contain 50 percents of the points of the subcloud.
This function has to be used after the cloud of individuals has been drawn.
References
Le Roux B. and Rouanet H., Multiple Correspondence Analysis, SAGE, Series: Quantitative Applications in the Social Sciences, Volume 163, CA:Thousand Oaks (2010).
Le Roux B. and Rouanet H., Geometric Data Analysis: From Correspondence Analysis to Stuctured Data Analysis, Kluwer Academic Publishers, Dordrecht (June 2004).
See also
Examples
## Performs specific MCA (excluding 'NA' categories) of 'Taste' example data set,
## plots the cloud of categories
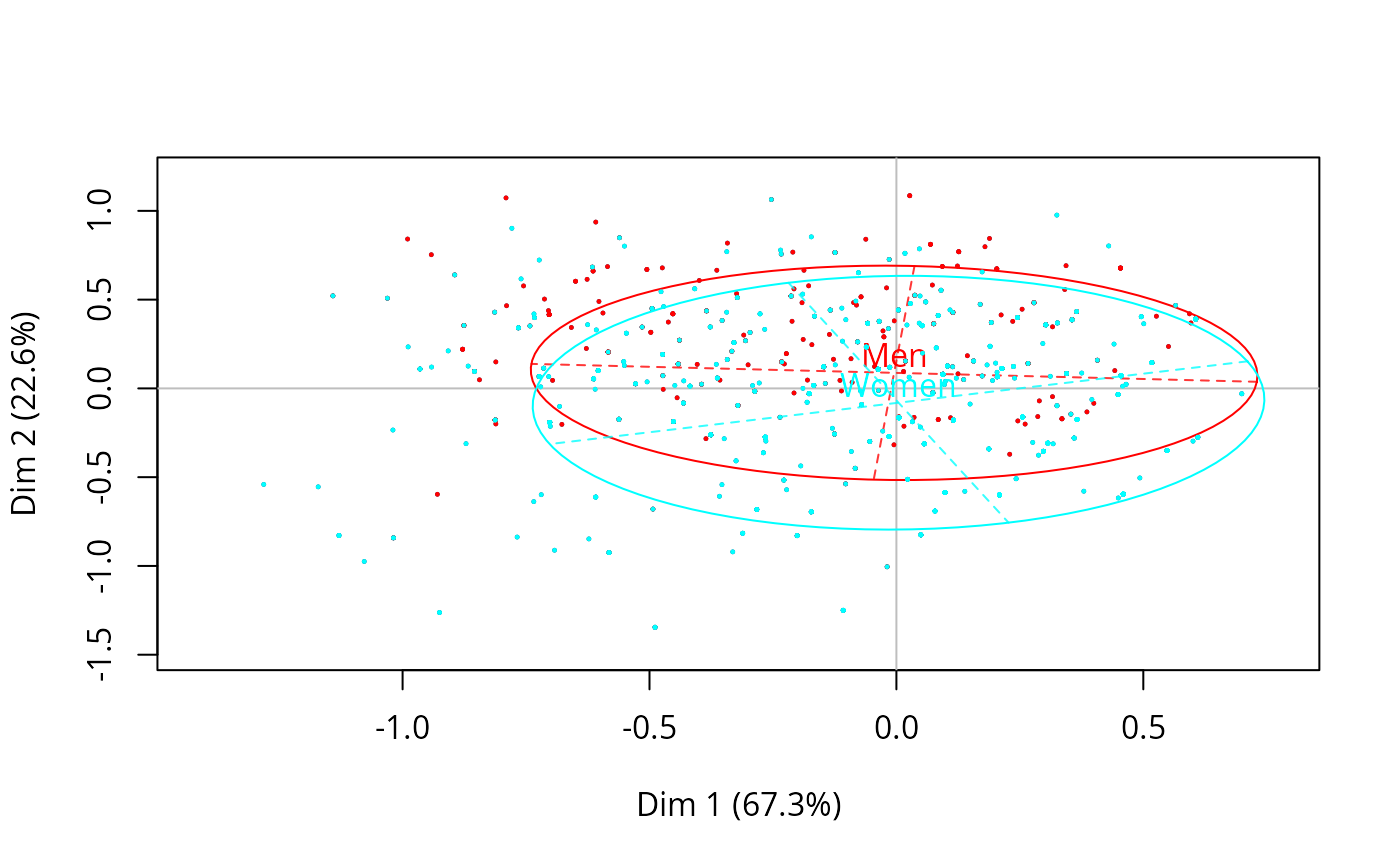
## and adds concentration ellipses for gender variable
data(Taste)
junk <- c("FrenchPop.NA", "Rap.NA", "Rock.NA", "Jazz.NA", "Classical.NA",
"Comedy.NA", "Crime.NA", "Animation.NA", "SciFi.NA", "Love.NA",
"Musical.NA")
mca <- speMCA(Taste[,1:11], excl = junk)
plot(mca, type = "i")
conc.ellipse(mca, Taste$Gender)
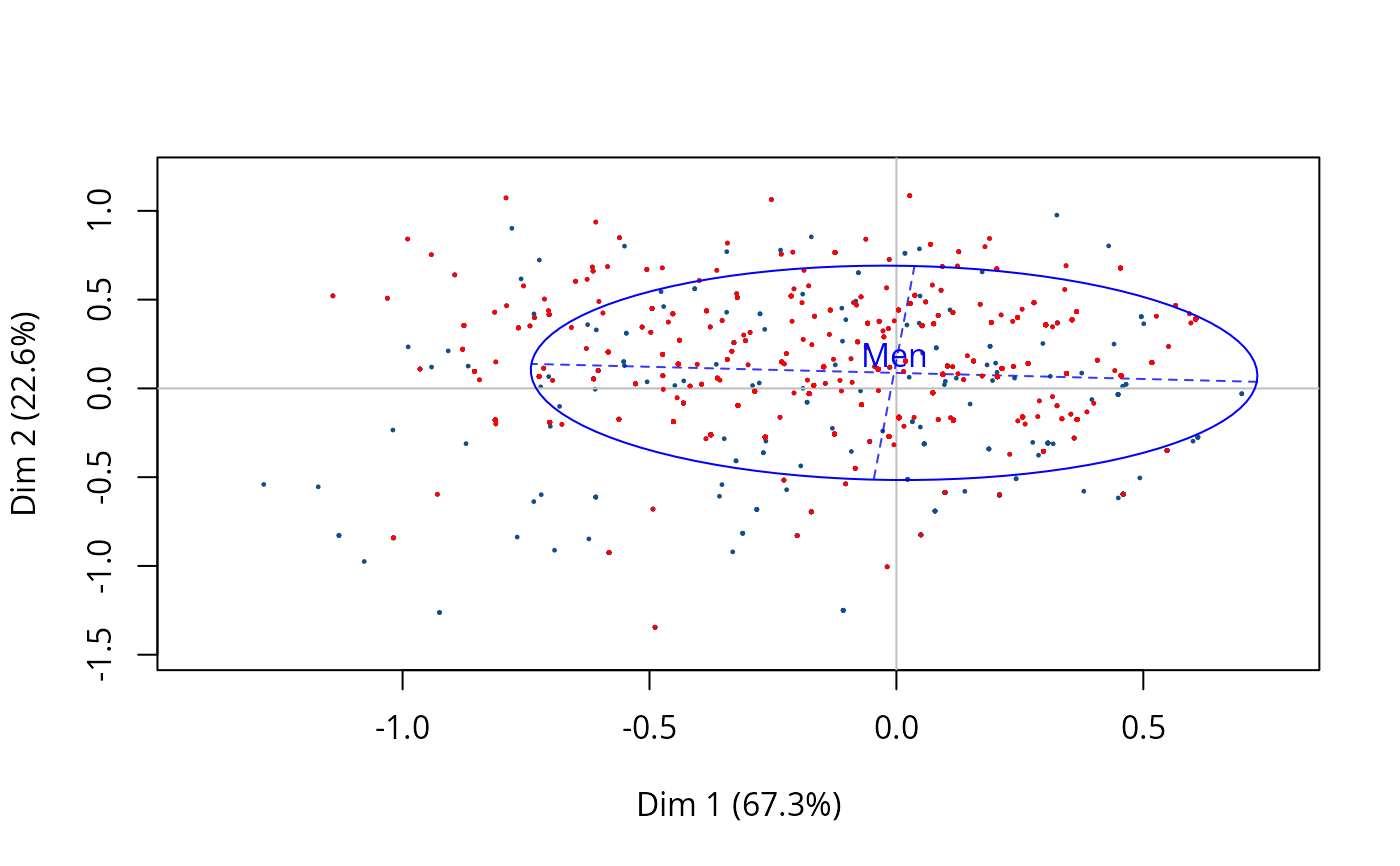
 ## Draws a blue concentration ellipse for men only
plot(mca, type = "i")
conc.ellipse(mca, Taste$Gender, sel = 1, col = "blue")
## Draws a blue concentration ellipse for men only
plot(mca, type = "i")
conc.ellipse(mca, Taste$Gender, sel = 1, col = "blue")