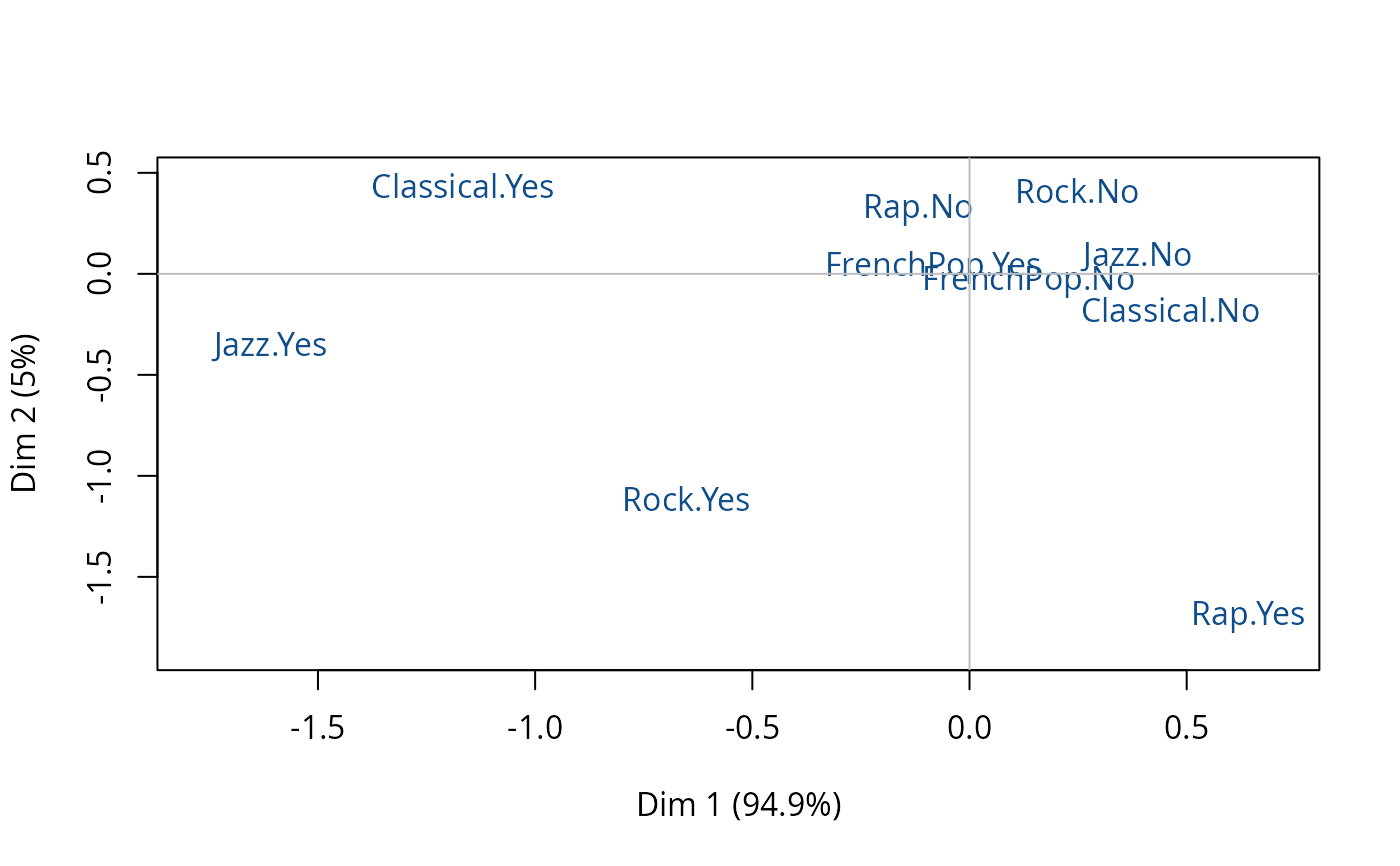
Plot of specific MCA
plot.speMCA.RdPlots a specific Multiple Correspondence Analysis (resulting from speMCA function), i.e. the clouds of individuals or categories.
Arguments
- x
object of class
speMCA- type
character string: 'v' to plot the categories (default), 'i' to plot individuals' points, 'inames' to plot individuals' names
- axes
numeric vector of length 2, specifying the components (axes) to plot (c(1,2) is default)
- points
character string. If 'all' all points are plotted (default); if 'besth' only those who contribute most to horizontal axis are plotted; if 'bestv' only those who contribute most to vertical axis are plotted; if 'besthv' only those who contribute most to horizontal or vertical axis are plotted; if 'best' only those who contribute most to the plane are plotted.
- col
color for the points of the individuals or for the labels of the categories (default is 'dodgerblue4')
- app
numerical value. If 0 (default), only the labels of the categories are plotted and their size is constant; if 1, only the labels are plotted and their size is proportional to the weights of the categories; if 2, points (triangles) and labels are plotted, and points size is proportional to the weight of the categories.
- ...
further arguments passed to or from other methods, such as cex, cex.main, ...
Details
A category is considered to be one of the most contributing to a given axis if its contribution is higher than the average contribution, i.e. 100 divided by the total number of categories.
References
Le Roux B. and Rouanet H., Multiple Correspondence Analysis, SAGE, Series: Quantitative Applications in the Social Sciences, Volume 163, CA:Thousand Oaks (2010).
Le Roux B. and Rouanet H., Geometric Data Analysis: From Correspondence Analysis to Stuctured Data Analysis, Kluwer Academic Publishers, Dordrecht (June 2004).