Plot of standardized MCA
plot.stMCA.RdPlots a standardized Multiple Correspondence Analysis (resulting from stMCA function), i.e. the clouds of individuals or categories.
# S3 method for class 'stMCA'
plot(x, type = "v", axes = 1:2, points = "all", threshold = 2.58, groups=NULL,
                            col = "dodgerblue4", app = 0, ...)
Arguments
- x
object of class
stMCA- type
character string: 'v' to plot the categories (default), 'i' to plot individuals' points, 'inames' to plot individuals' names
- axes
numeric vector of length 2, specifying the components (axes) to plot (c(1,2) is default)
- points
character string. If 'all' all points are plotted (default); if 'besth' only those who are the most correlated to horizontal axis are plotted; if 'bestv' only those who are the most correlated to vertical axis are plotted; if 'best' only those who are the most coorelated to horizontal or vertical axis are plotted.
- threshold
numeric value. V-test minimal value for the selection of plotted categories.
- groups
only if x$call$input.mca = 'multiMCA', i.e. if the MCA standardized to x object was a
multiMCAobject. Numeric vector specifying the groups of categories to plot. By default, every groups of categories will be plotted- col
color for the points of the individuals or for the labels of the categories (default is 'dodgerblue4')
- app
numerical value. If 0 (default), only the labels of the categories are plotted and their size is constant; if 1, only the labels are plotted and their size is proportional to the weights of the categories; if 2, points (triangles) and labels are plotted, and points size is proportional to the weight of the categories.
- ...
further arguments passed to or from other methods, such as cex, cex.main, ...
Details
A category is considered to be one of the most correlated to a given axis if its test-value is higher then 2.58 (which corresponds to a 0.05 threshold).
References
Bry X., Robette N., Roueff O., 2016, « A dialogue of the deaf in the statistical theater? Adressing structural effects within a geometric data analysis framework », Quality & Quantity, 50(3), pp 1009–1020 [https://link.springer.com/article/10.1007/s11135-015-0187-z]
See also
Examples
# standardized MCA of Music example data set
# controlling for age
## and then draws the cloud of categories.
data(Music)
junk <- c("FrenchPop.NA", "Rap.NA", "Rock.NA", "Jazz.NA", "Classical.NA")
mca <- speMCA(Music[,1:5], excl = junk)
stmca <- stMCA(mca, control = list(Music$Age))
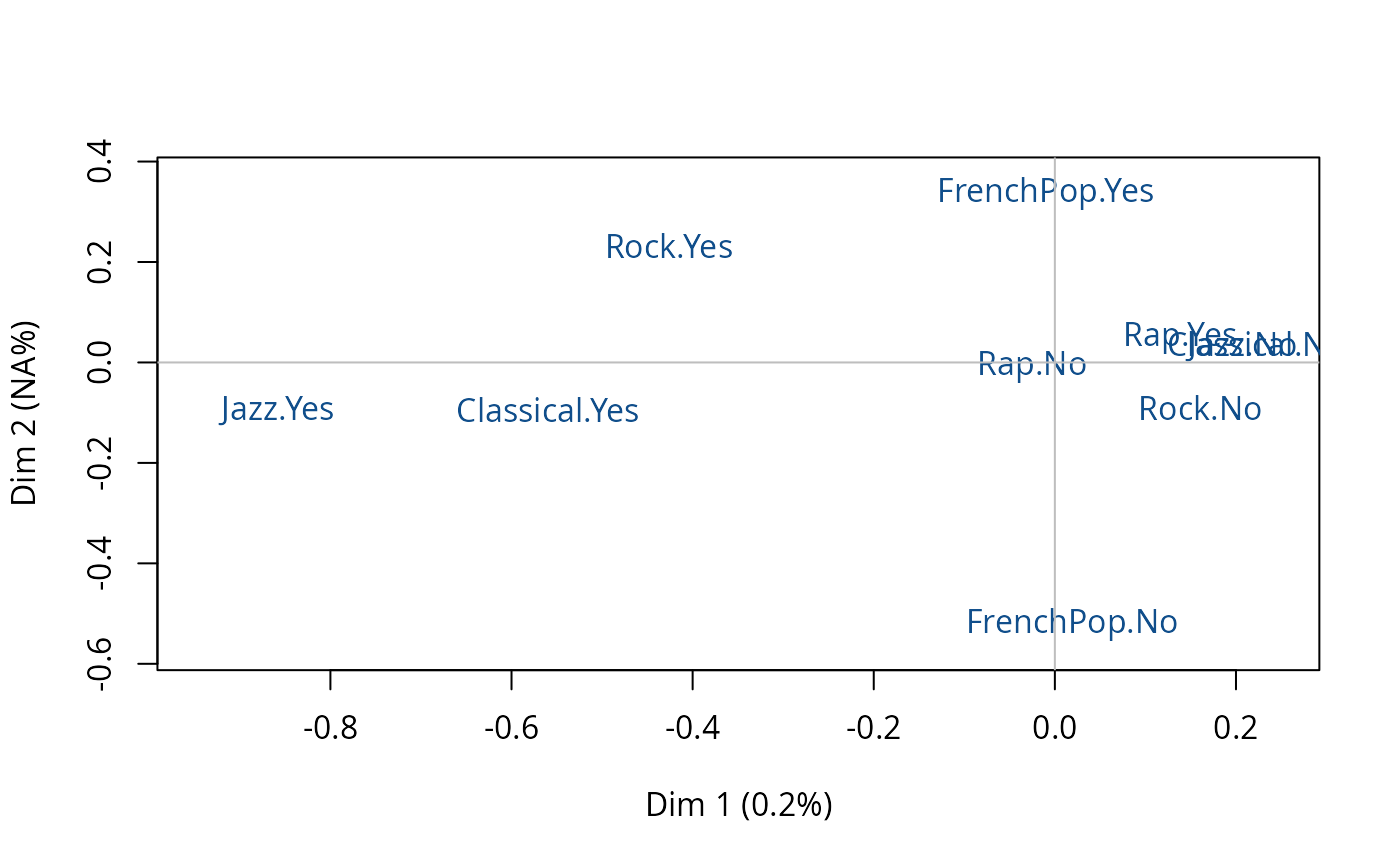
# cloud of categories
plot(stmca)
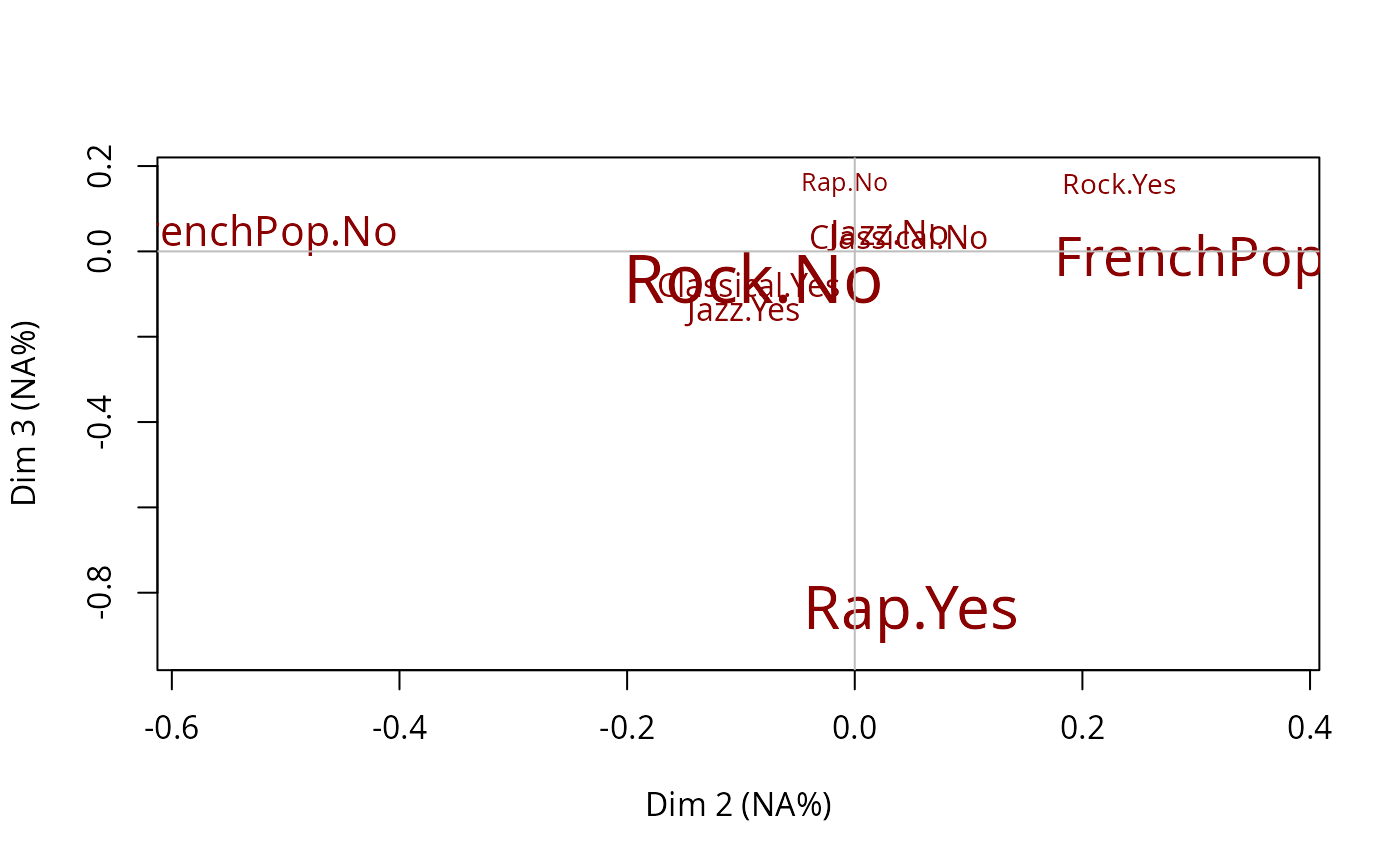
 # cloud of categories on dimensions 2 and 3
plot(stmca, axes = c(2,3), points = "best", col = "darkred", app = 1)
# cloud of categories on dimensions 2 and 3
plot(stmca, axes = c(2,3), points = "best", col = "darkred", app = 1)