Plot of Multiple Factor Analysis
plot.multiMCA.RdPlots Multiple Factor Analysis data, resulting from multiMCA function.
Arguments
- x
object of class
multiMCA- type
character string: 'v' to plot the categories (default), 'i' to plot individuals' points, 'inames' to plot individuals' names
- axes
numeric vector of length 2, specifying the components (axes) to plot (c(1,2) is default)
- points
character string. If 'all' all points are plotted (default); if 'besth' only those who are the most correlated to horizontal axis are plotted; if 'bestv' only those who are the most correlated to vertical axis are plotted; if 'best' only those who are the most coorelated to horizontal or vertical axis are plotted.
- threshold
numeric value. V-test minimal value for the selection of plotted categories.
- groups
numeric vector specifying the groups of categories to plot. By default, every groups of categories will be plotted
- col
a color for the points of the individuals or a vector of colors for the labels of the groups of categories (by default, rainbow palette is used)
- app
numerical value. If 0 (default), only the labels of the categories are plotted and their size is constant; if 1, only the labels are plotted and their size is proportional to the weights of the categories; if 2, points (triangles) and labels are plotted, and points size is proportional to the weight of the categories.
- ...
further arguments passed to or from other methods, such as cex, cex.main, ...
Details
A category is considered to be one of the most correlated to a given axis if its test-value is higher then 2.58 (which corresponds to a 0.05 threshold).
References
Escofier, B. and Pages, J. (1994) "Multiple Factor Analysis (AFMULT package)". Computational Statistics and Data Analysis, 18, 121-140.
See also
Examples
# specific MCA on music variables of Taste example data set
## another one on movie variables of 'Taste' example data set,
## and then a Multiple Factor Analysis and plots the results.
data(Taste)
# specific MCA on music variables of Taste example data set
mca1 <- speMCA(Taste[,1:5], excl = c(3,6,9,12,15))
# specific MCA on movie variables of Taste example data set
mca2 <- speMCA(Taste[,6:11], excl = c(3,6,9,12,15,18))
# Multiple Factor Analysis
mfa <- multiMCA(list(mca1,mca2))
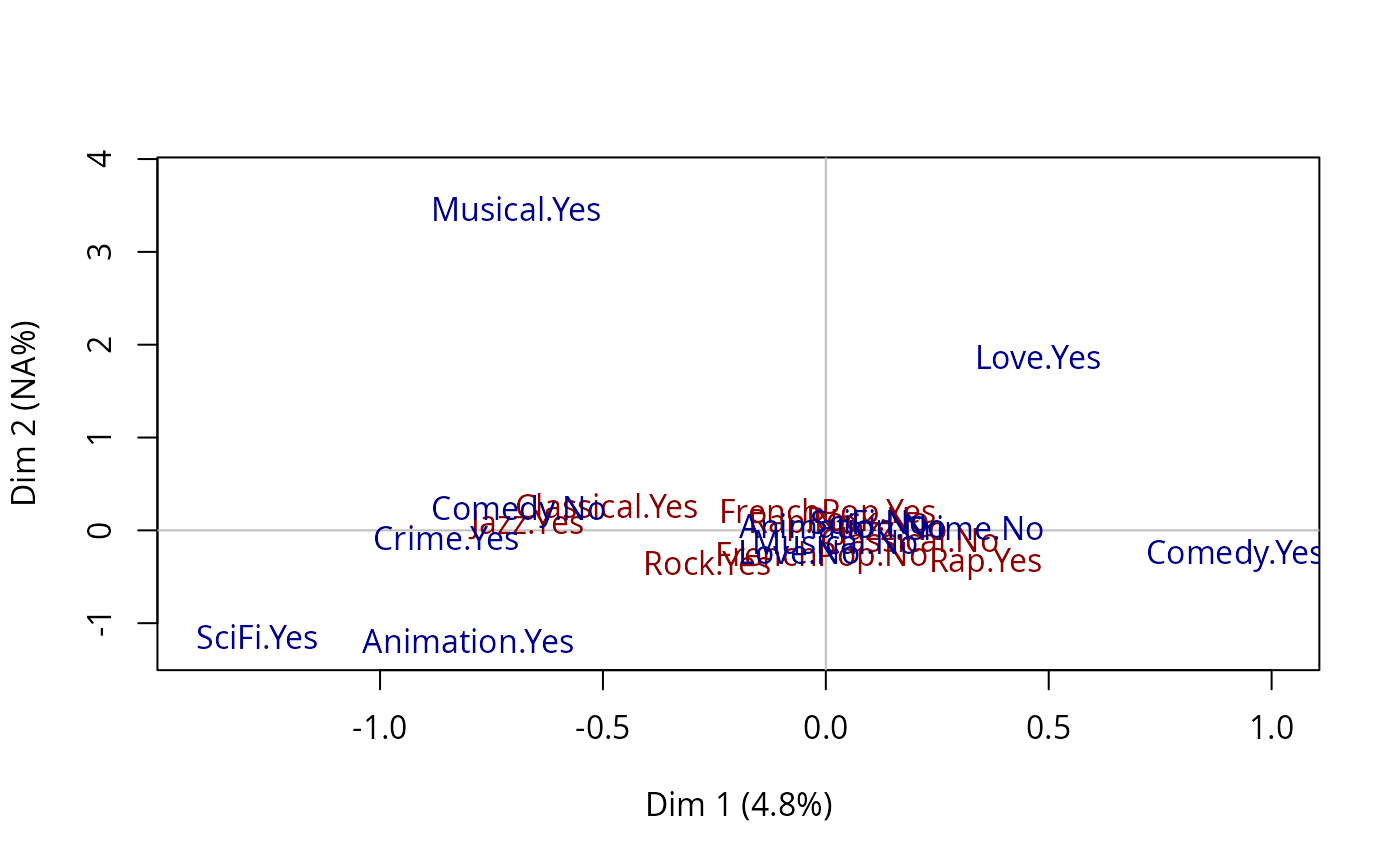
# plot
plot.multiMCA(mfa, col = c("darkred", "darkblue"))
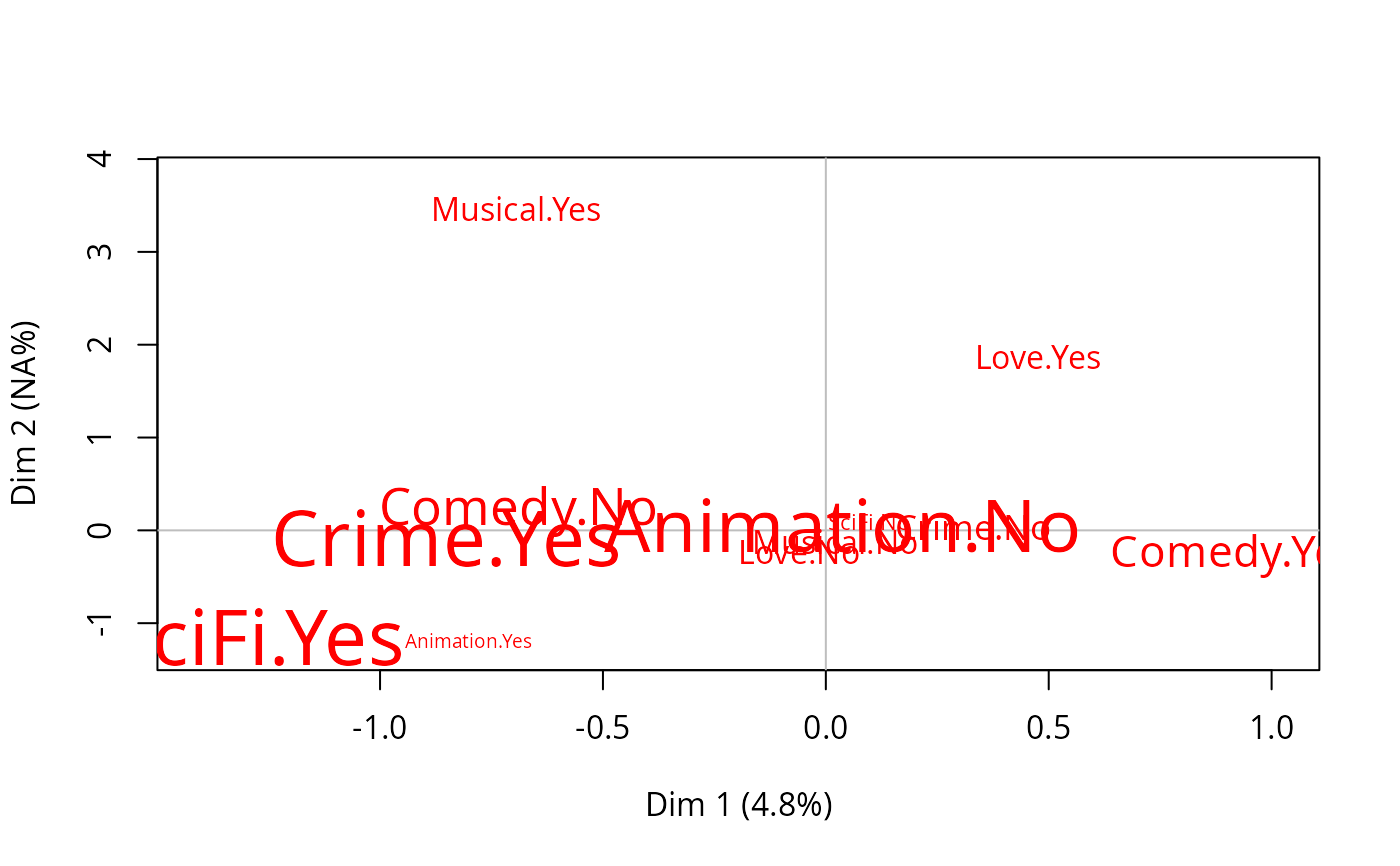
 # plot of the second set of variables (movie)
plot.multiMCA(mfa, groups = 2, app = 1)
# plot of the second set of variables (movie)
plot.multiMCA(mfa, groups = 2, app = 1)