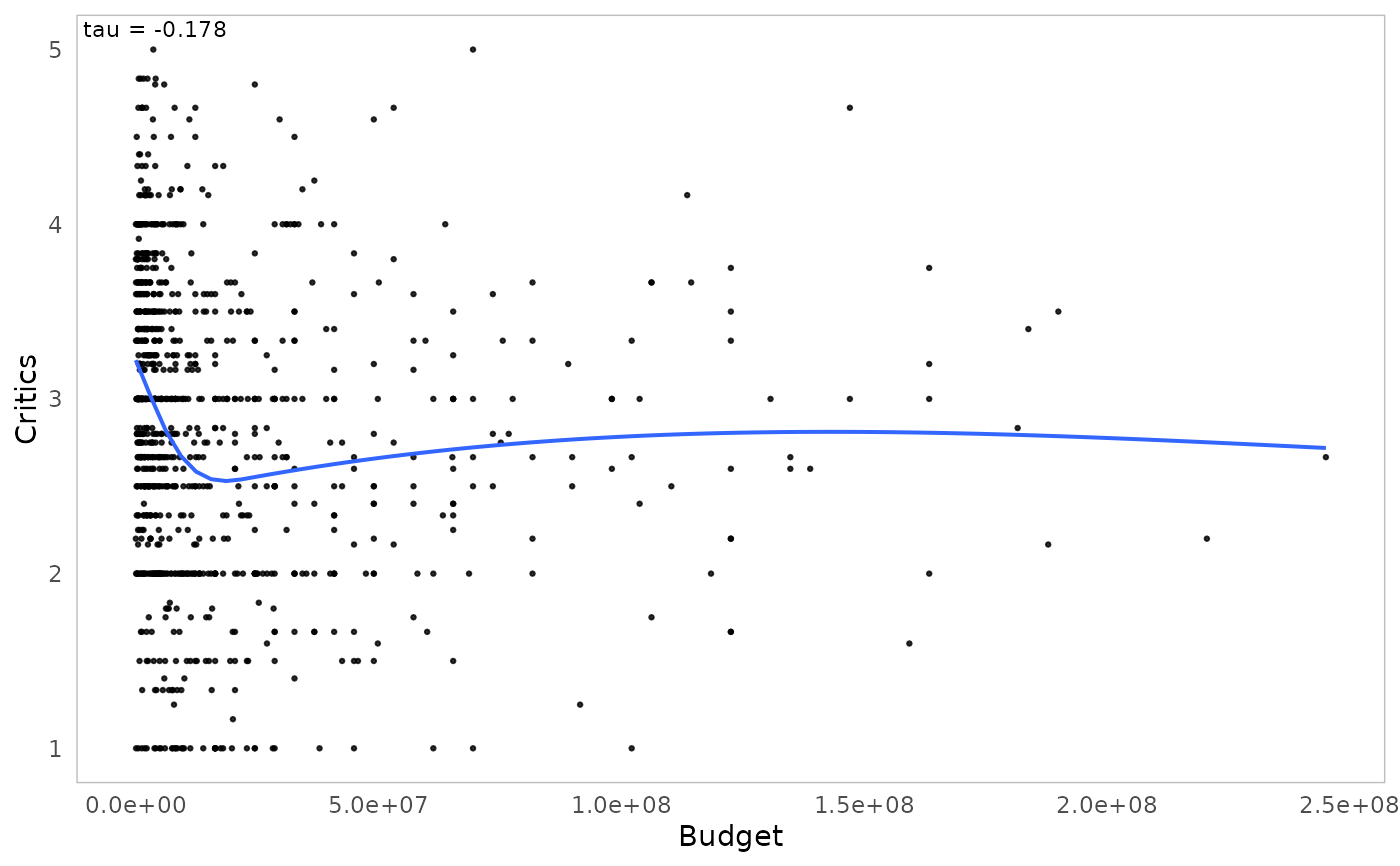
Scatter plot with a smoothing line
ggassoc_scatter.RdDisplays of scatter plot and adds a smoothing line, using ggplot2.
ggassoc_scatter(data, mapping, na.rm = FALSE,
axes.labs = TRUE, ticks.labs = TRUE, text.size = 3)
Arguments
- data
dataset to use for plot
- mapping
aesthetic being used. It must specify x and y.
- na.rm
logical, indicating whether NA values should be silently removed before the computation proceeds. Default is FALSE.
- axes.labs
Whether to display the labels of the axes, i.e. the names of x and y. Default is TRUE.
- ticks.labs
Whether to display the labels of the categories of x and y. Default is TRUE.
- text.size
Size of the association measure. If NULL, the text is not added to the plot.
Details
Kendall's tau rank correlation between x and y is displayed in upper-left corner of the plot.
Smoothing is performed with gam.
This function can be used as a high-level plot with ggduo and ggpairs functions of the GGally package.
Value
a ggplot object