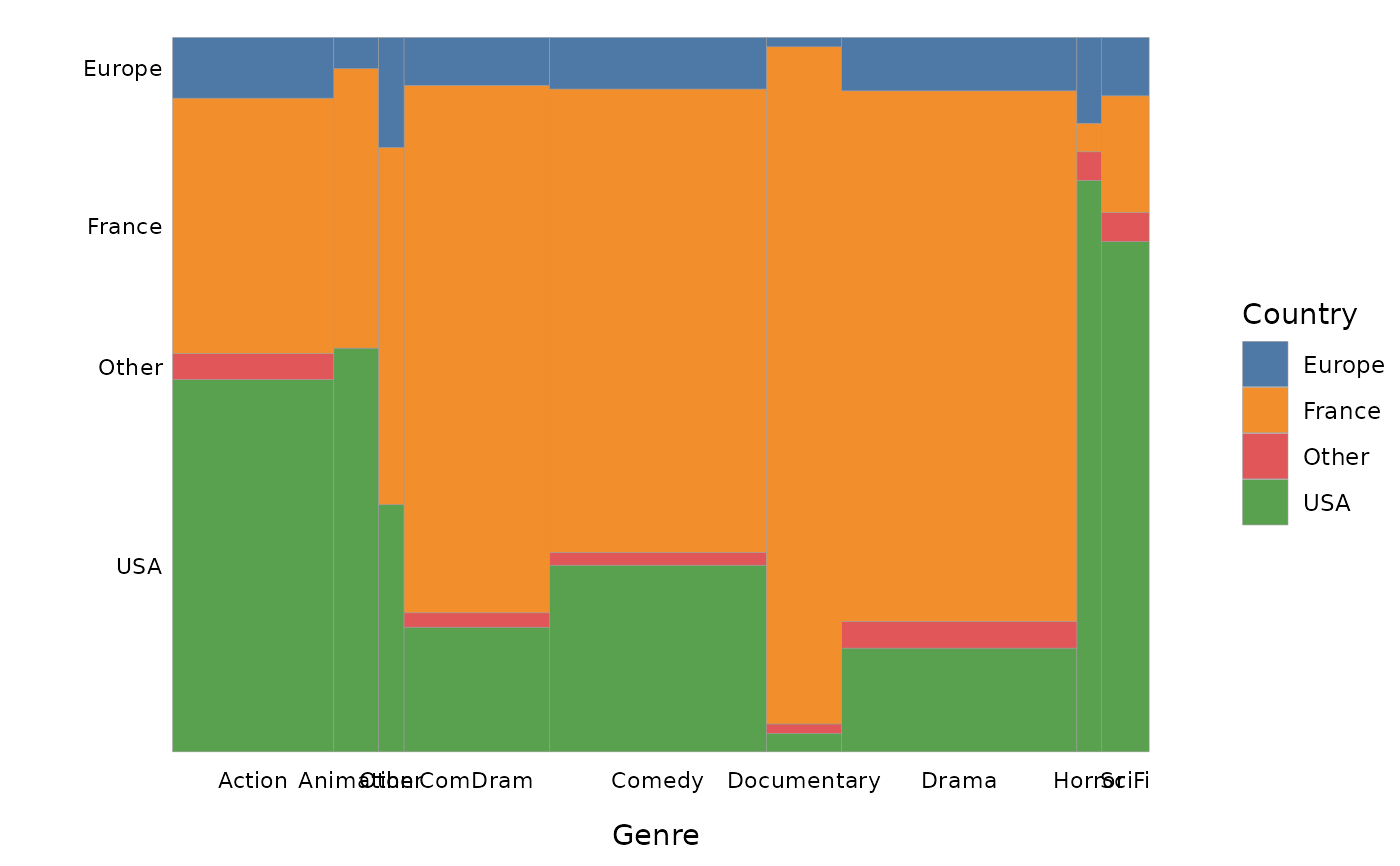
Marimekko plot
ggassoc_marimekko.RdFor a cross-tabulation, plots a marimekko chart (also called mosaic plot), using ggplot2.
ggassoc_marimekko(data, mapping, type = "classic",
measure = "phi", limits = NULL,
na.rm = FALSE, na.value = "NAs",
palette = NULL, colors = NULL, direction = 1,
linecolor = "gray60", linewidth = 0.1,
sort = "none", legend = "right")
Arguments
- data
dataset to use for plot
- mapping
aesthetics being used. x and y are required, weight can also be specified.
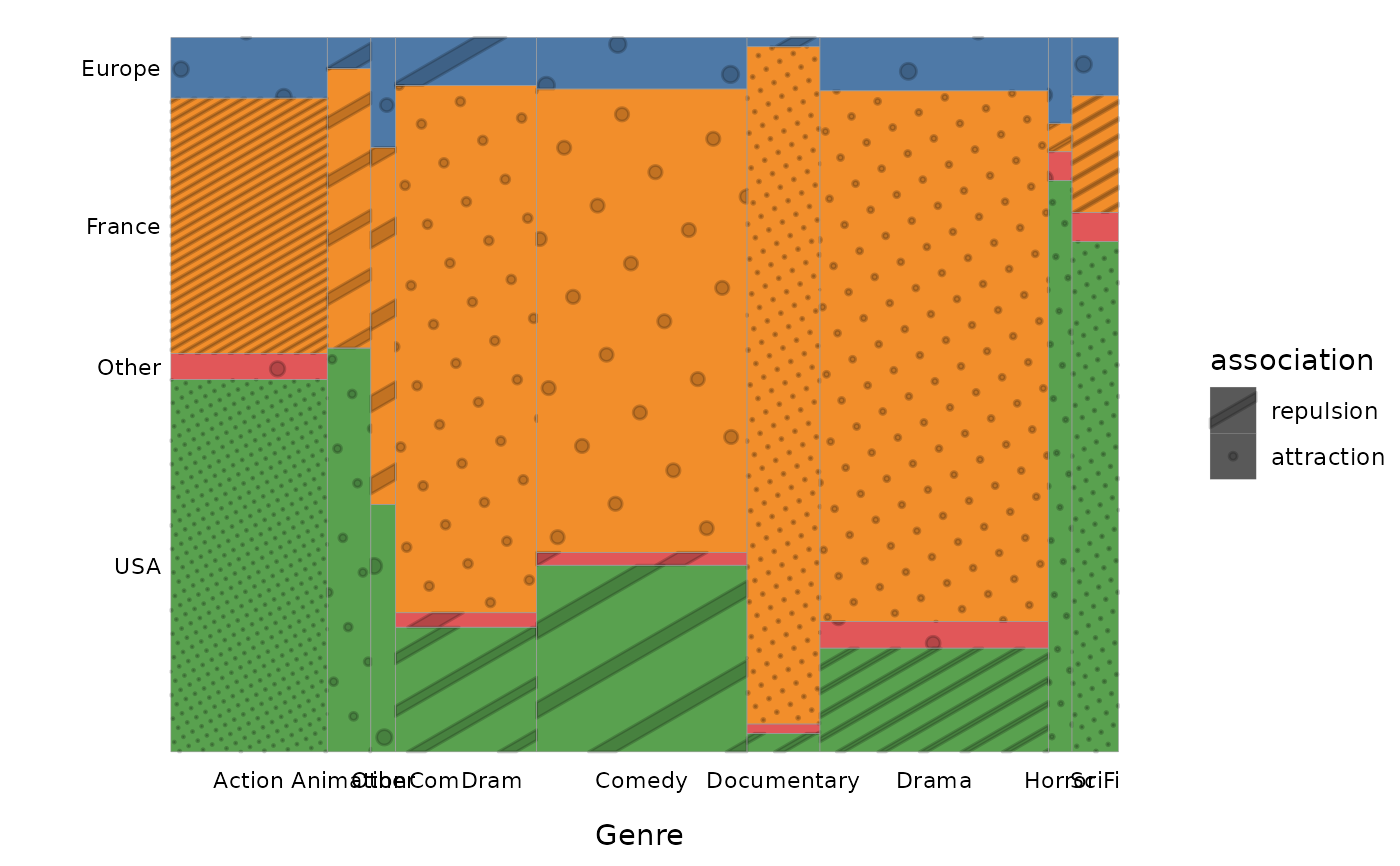
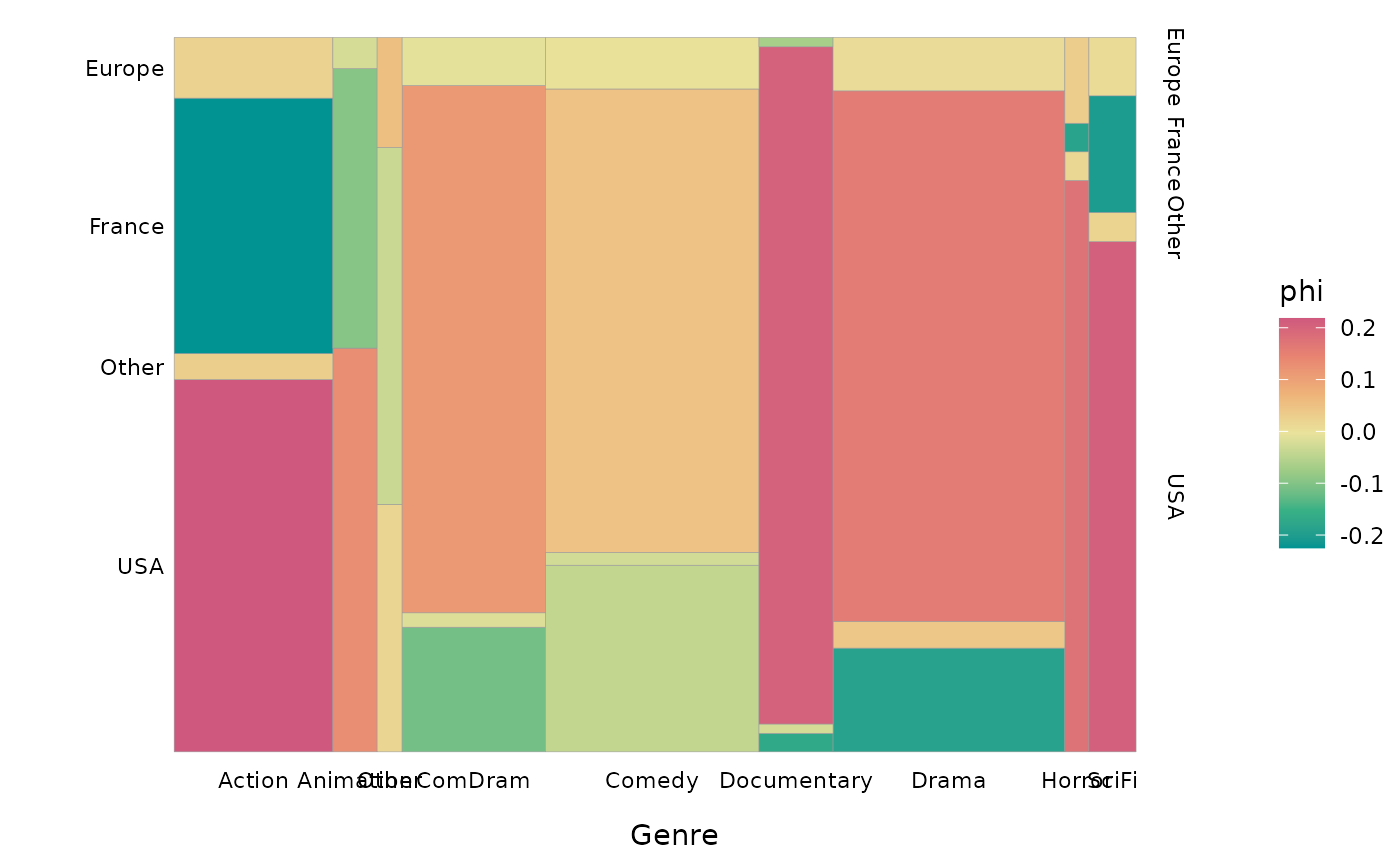
- type
character. If "classic" (default), a simple marimekko chart is plotted, with no use of local associations. If type is "shades", tiles are shaded according to the local associations between categories. If type is "patterns", tiles are filled with patterns, and the density of patterns is proportional to the absolute level of local association between categories.
- measure
character. The measure of association used for filling (if type is "shades) or patterning (if type is "patterns") the tiles. Can be "phi" for phi coefficient, "or" for odds ratios, "std.residuals" (default) for standardized (i.e. Pearson) residuals, "adj.residuals" for adjusted standardized residuals or "pem" for local percentages of maximum deviation from independence.
- limits
a numeric vector of length two providing limits of the scale. If NULL (default), the limits are automatically adjusted to the data. Only used for type "shades".
- na.rm
logical, indicating whether NA values should be silently removed before the computation proceeds. If FALSE (default), an additional level is added to the variables (see na.value argument).
- na.value
character. Name of the level for NA category. Default is "NAs". Only used if na.rm = FALSE.
- palette
A character vector of color codes. The number of colors should be equal or higher than the number of categories in y. If NULL (default), the "Tableau" palette from
ggthemespackage is used. Only used for types "classic" and "patterns".- colors
vector of colors that will be interpolated to produce a color gradient. If NULL (default), the "Temps" palette from
rcartocolorspackage is used. Only used for type "shades".- direction
Sets the order of colours in the scale. If 1, the default, colours are as output by RColorBrewer::brewer.pal(). If -1, the order of colours is reversed.
- linecolor
character. Color of the contour lines of the tiles. Default is gray60.
- linewidth
numeric. Width of the contour lines of the tiles. Default is 0.1.
- sort
character. If "both", rows and columns are sorted according to the first factor of a correspondence analysis of the contingency table. If "x", only rows are sorted. If "y", only columns are sorted. If "none" (default), no sorting is done.
- legend
the position of legend ("none", "left", "right", "bottom", "top"). If "none", no legend is displayed.
Details
The measure of local association measures how much each combination of categories of x and y is over/under-represented.
This function can be used as a high-level plot with ggduo and ggpairs functions of the GGally package.
Note : It does not allow faceting.
Value
a ggplot object
References
Hartigan, J.A., and Kleiner, B. (1984), "A mosaic of television ratings". The American Statistician, 38, 32–35.
Friendly, M. (1994), "Mosaic displays for multi-way contingency tables". Journal of the American Statistical Association, 89, 190–200.