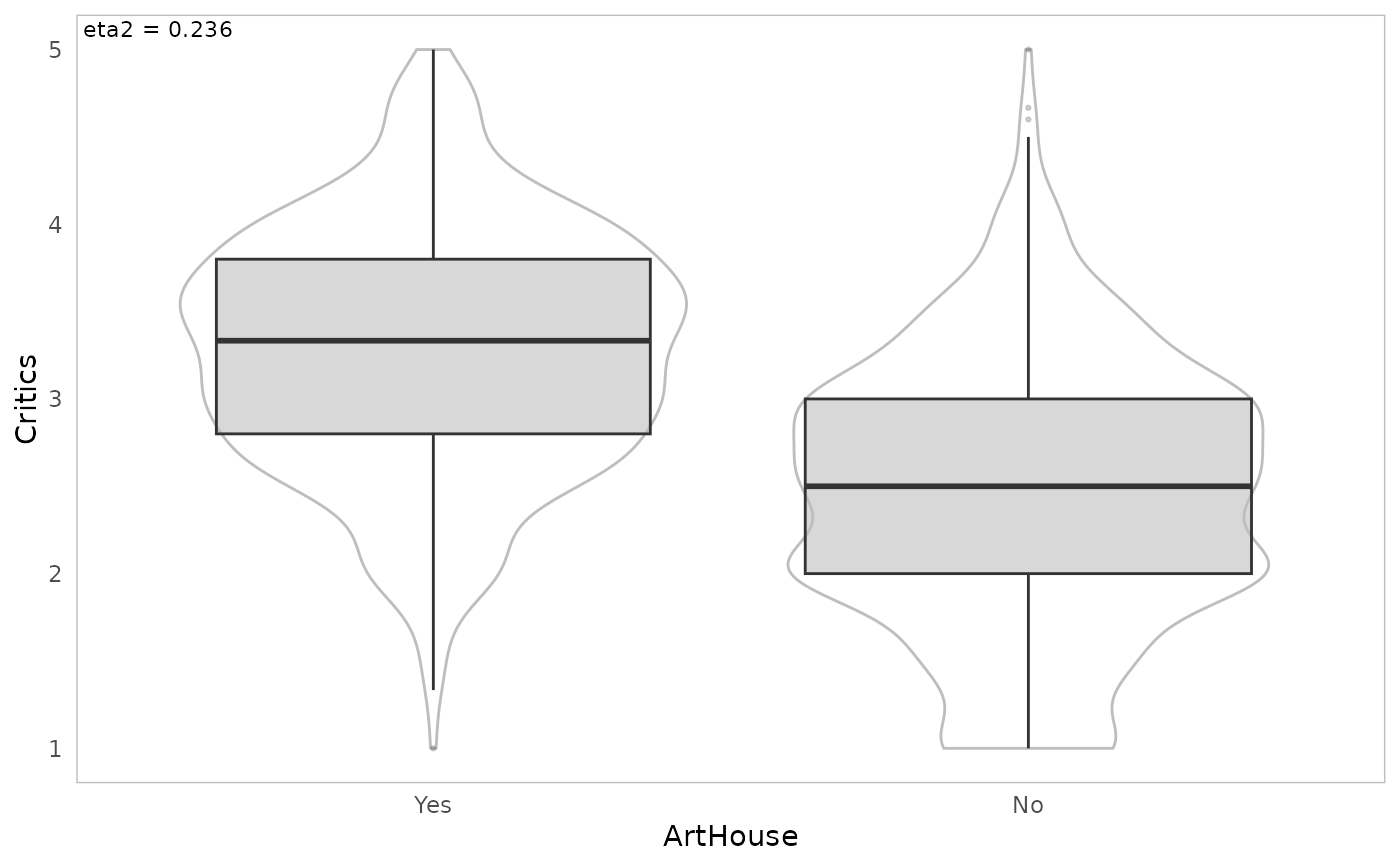
Boxplots with violins
ggassoc_boxplot.RdDisplays of boxplot and combines it with a violin plot, using ggplot2.
ggassoc_boxplot(data, mapping,
na.rm.cat = FALSE, na.value.cat = "NAs", na.rm.cont = FALSE,
axes.labs = TRUE, ticks.labs = TRUE, text.size = 3,
sort = FALSE, box = TRUE, notch = FALSE, violin = TRUE)
Arguments
- data
dataset to use for plot
- mapping
aesthetic being used. It must specify x and y.
- na.rm.cat
logical, indicating whether NA values in the categorical variable (i.e. x) should be silently removed before the computation proceeds. If FALSE (default), an additional level is added to the categorical variable (see na.value.cat argument).
- na.value.cat
character. Name of the level for NA category. Default is "NAs". Only used if na.rm = FALSE.
- na.rm.cont
logical, indicating whether NA values in the continuous variable (i.e. y) should be silently removed before the computation proceeds. Default is FALSE.
- axes.labs
Whether to display the labels of the axes, i.e. the names of x and y. Default is TRUE.
- ticks.labs
Whether to display the labels of the categories of x and y. Default is TRUE.
- text.size
Size of the association measure. If NULL, the text is not added to the plot.
- sort
logical. If TRUE, the levels of the categorical variable are reordered according to the conditional medians, so that boxplots are sorted. Default is FALSE.
- box
Whether to draw boxplots. Default is TRUE.
- notch
If FALSE (default) make a standard box plot. If TRUE, make a notched box plot. Notches are used to compare groups; if the notches of two boxes do not overlap, this suggests that the medians are significantly different.
- violin
Whether to draw a violin plot. Default is TRUE.
Details
Eta-squared measure of global association between x and y is displayed in upper-left corner of the plot.
This function can be used as a high-level plot with ggduo and ggpairs functions of the GGally package.
Value
a ggplot object
