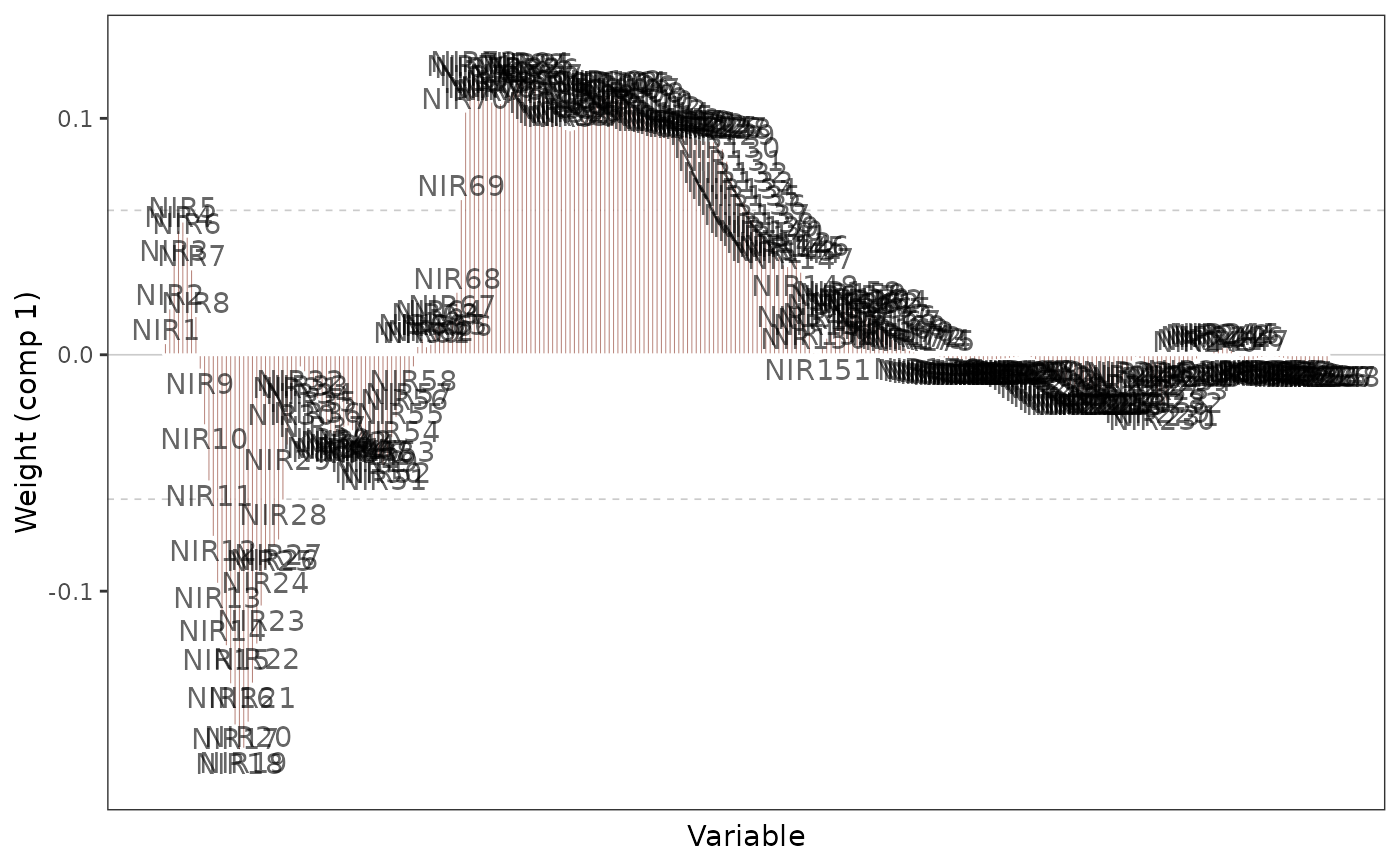
Plot of weights
plo_ctr.RdPlots the weights of X variables from a PLS regression.
plo_ctr(object, comp = 1, sort = FALSE, col = "tomato4", repel = FALSE)Arguments
- object
an object of class
mvrfromplspackage- comp
the component to use. Default is 1.
- sort
logical. If
TRUE, bars are sorted by decreasing VIPs. Default isFALSE.- col
color of the bars
- repel
logical. If
TRUE, the names of the variables are repelled withgeom_text_repel. Default isFALSE
Value
a ggplot2 object
Details
According to Tenenhaus, the contribution of a variable to the construction of a component is measured by the squared loading weight. For a given component, the sum af the squared loading weights is equal to 1. This plot represents the loading weights, which keeps the information about their sign. Dashed lines are added at +/- sqrt(1/p), with p the number of X variables, which corresponds to the average contribution to the construction of the component.
References
Martens, H., Næs, T. (1989) Multivariate calibration. Chichester: Wiley.
Tenenhaus, M. (1998) La Regression PLS. Theorie et Pratique. Editions TECHNIP, Paris.