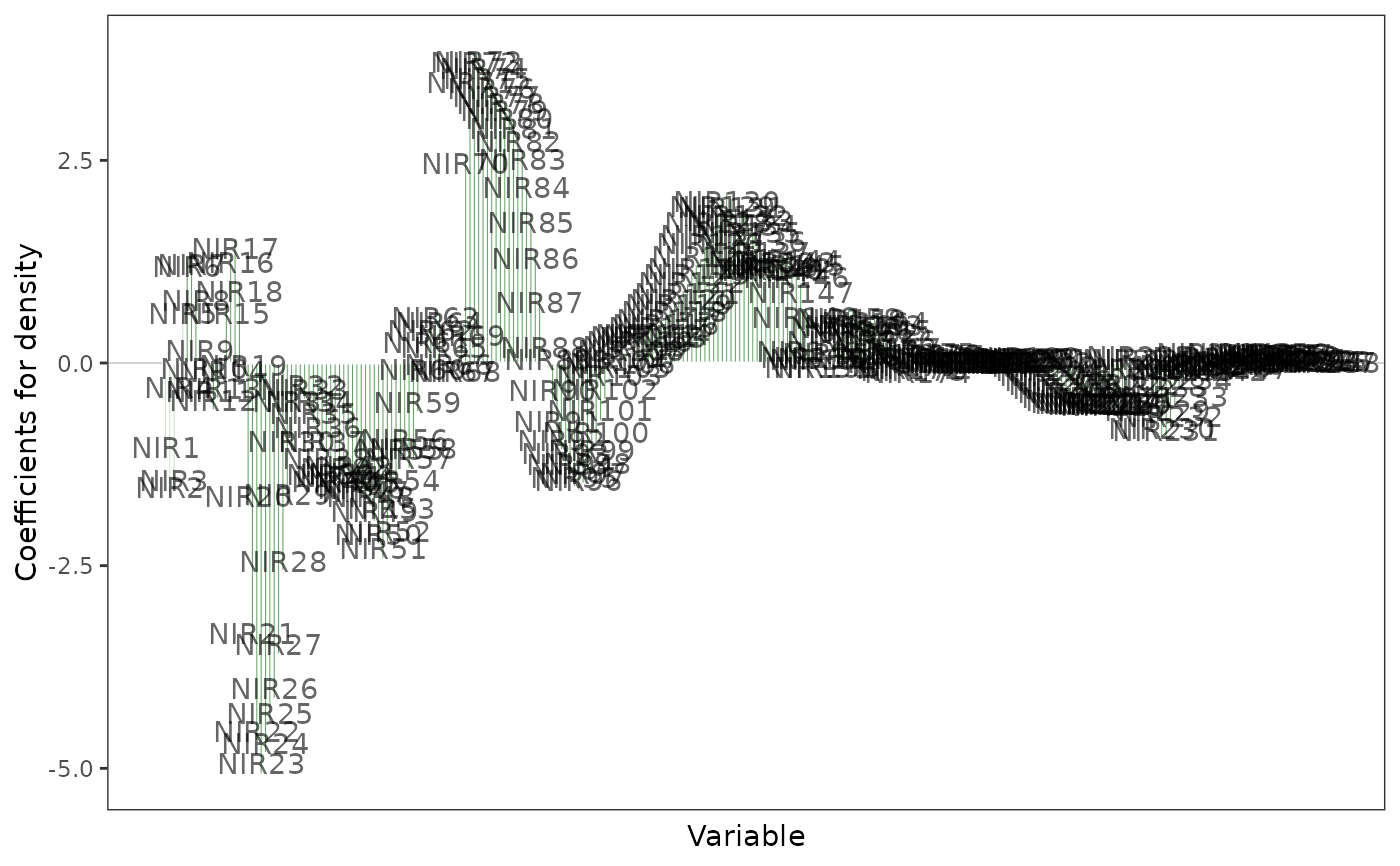
Plot of coefficients
plo_coef.RdPlots the coefficients from a PLS regression.
plo_coef(object, y = NULL, ncomp = NULL, sort = FALSE,
                     col = "darkgreen", repel = FALSE,
                     max.pval = NULL, whiskers = FALSE, ci = 0.95)
Arguments
- object
an object of class
mvrfromplspackage- y
the name of the response variable whose coefficients are plotted. If
NULL(default), the first response variable is used.- ncomp
the number of components to use for computing coefficients
- sort
logical. If
TRUE, bars are sorted by decreasing coefficients. Default isFALSE.- col
color of the bars
- repel
logical. If
TRUE, the names of the variables are repelled withgeom_text_repel. Default isFALSE- max.pval
coefficients with jack-knife p-values higher than
max.pvalhave a more transparent color bar. IfNULL(default), all bars have the same opacity. If notNULL,objectmust be cross-validated withjackknife = TRUE.- whiskers
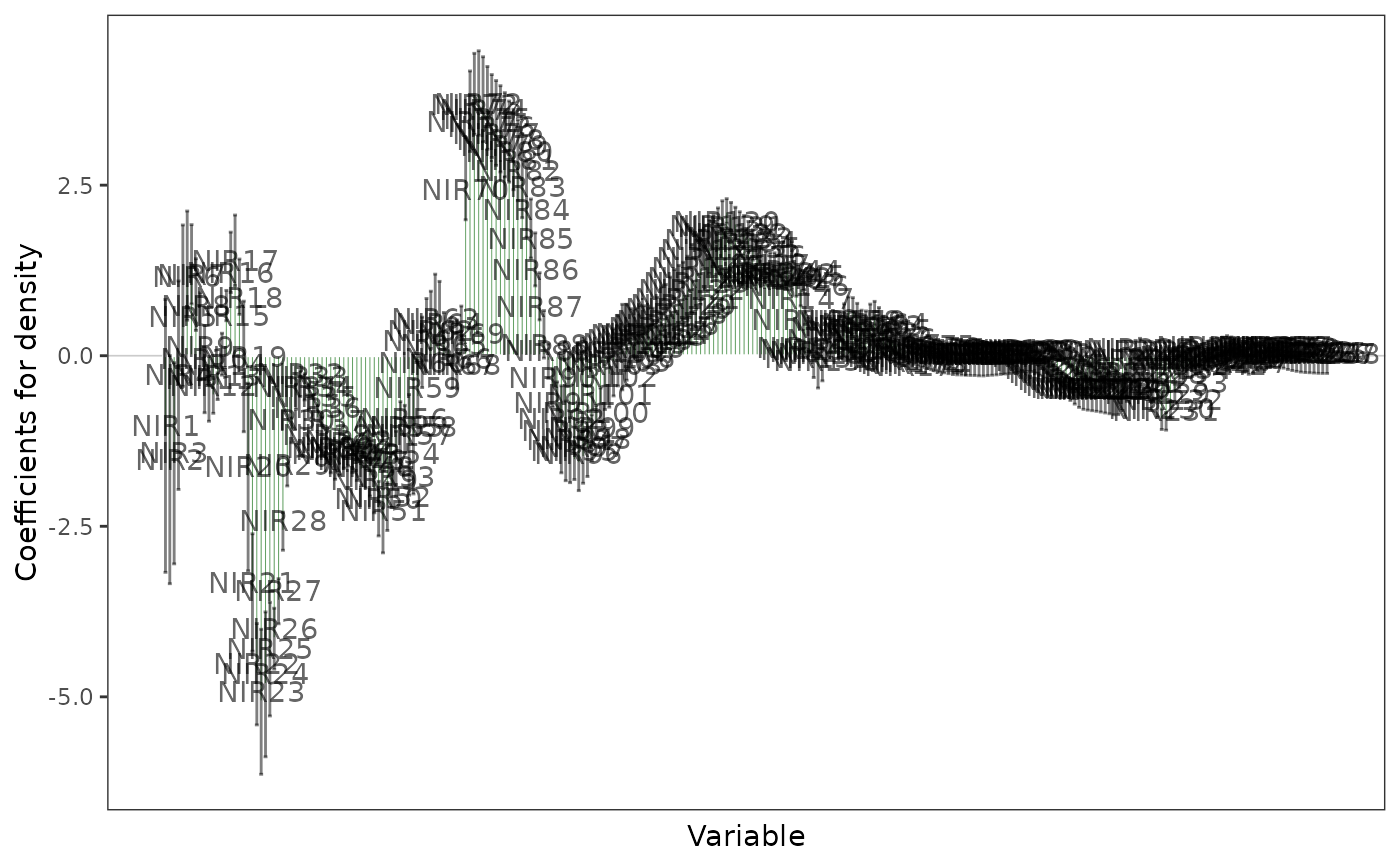
logical. If
TRUE, whiskers are added to represent the confidence interval of the coefficients. Default isFALSE. IfTRUE,objectmust be cross-validated withjackknife = TRUE.- ci
the confidence level of the confidence interval. Only used if
whiskersisTRUE. Default is 0.95.
Value
a ggplot2 object
References
Martens, H., Næs, T. (1989) Multivariate calibration. Chichester: Wiley.
Tenenhaus, M. (1998) La Regression PLS. Theorie et Pratique. Editions TECHNIP, Paris.