Within-class Principal Component Analysis
wcPCA.RdWithin-class Principal Component Analysis
wcPCA(X, class, scale.unit = TRUE, ncp = 5, ind.sup = NULL, quanti.sup = NULL,
          quali.sup = NULL, row.w = NULL, col.w = NULL, graph = FALSE,
          axes = c(1, 2))
Arguments
- X
a data frame with n rows (individuals) and p columns (numeric variables)
- class
factor specifying the class
- scale.unit
a boolean, if TRUE (default) then data are scaled to unit variance
- ncp
number of dimensions kept in the results (by default 5)
- ind.sup
a vector indicating the indexes of the supplementary individuals
- quanti.sup
a vector indicating the indexes of the quantitative supplementary variables
- quali.sup
a vector indicating the indexes of the categorical supplementary variables
- row.w
an optional row weights (by default, a vector of 1 for uniform row weights); the weights are given only for the active individuals
- col.w
an optional column weights (by default, uniform column weights); the weights are given only for the active variables
- graph
boolean, if TRUE a graph is displayed. Default is FALSE.
- axes
a length 2 vector specifying the components to plot
Details
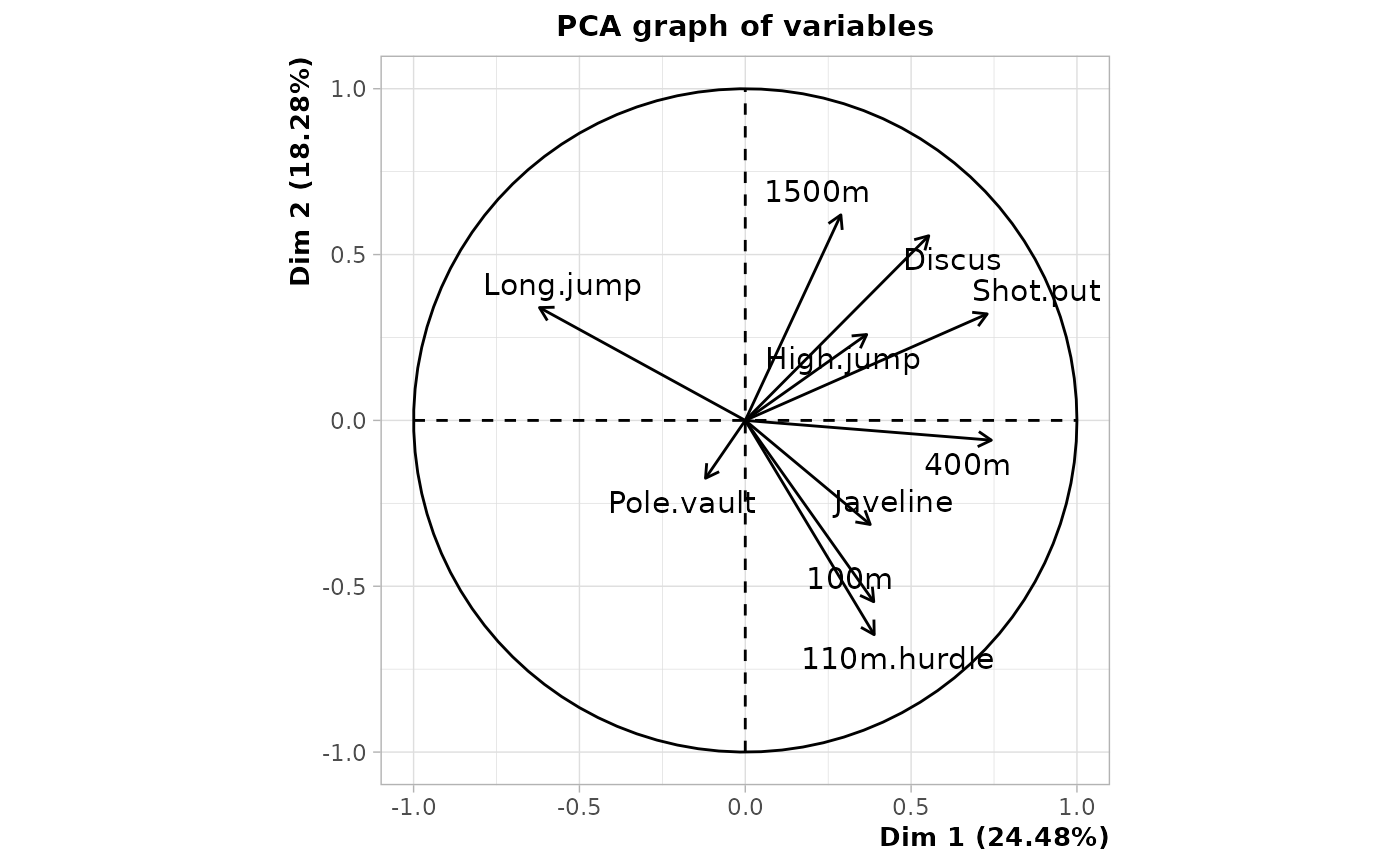
Within-class Principal Component Analysis is a PCA where the active variables are centered on the mean of their class instead of the overall mean.
It is a "conditional" PCA and can be seen as a special case of PCA with orthogonal instrumental variables, with only one (categorical) instrumental variable.
Value
An object of class PCA from FactoMineR package, with an additional item :
- ratio
the within-class inertia percentage
.
Note
The code is adapted from PCA function from FactoMineR package.
References
Escofier B., 1990, Analyse des correspondances multiples conditionnelle, La revue de Modulad, 5, 13-28.
Lebart L., Morineau A. et Warwick K., 1984, Multivariate Descriptive Statistical Analysis, John Wiley and sons, New-York.)
