eta-squared plot
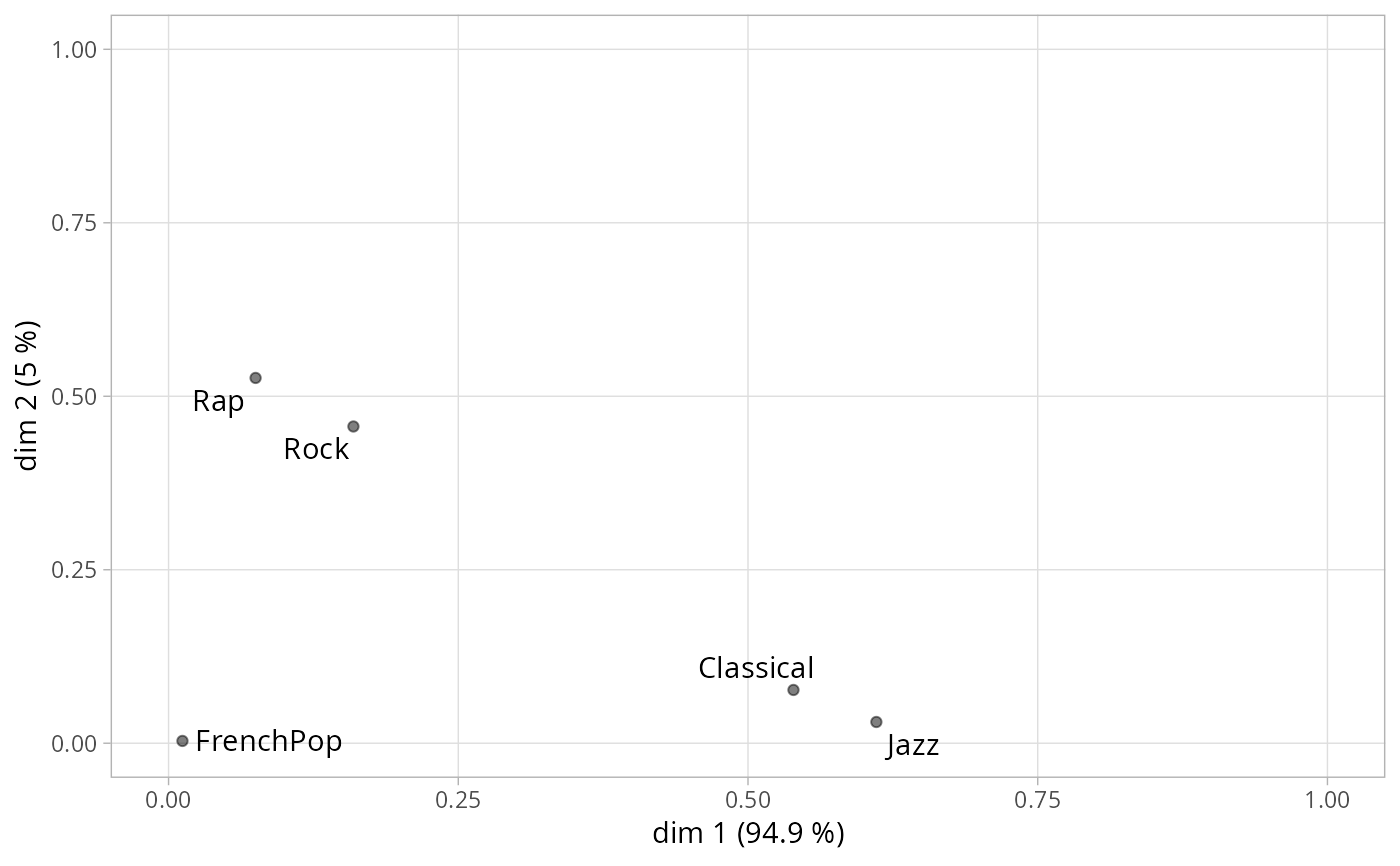
ggeta2_variables.RdPlots the eta-squared (squared correlation ratios) of the active variables of a MCA.
ggeta2_variables(resmca, axes = c(1,2))Arguments
Details
This plot was proposed by Escofier and Pagès (2008) under the name "carré des liaisons", i.e. square of relationships, using correlation ratios to measure these relationships. Eta-squared (i.e. correlation ratio) is a measure of global association between a continuous variable and a categorical variable : it measures the share of variance of the continuous variables "explained" by the categorical variable. Here, it is used to plot the association between the active variables and the axes of the MCA cloud.
Value
a ggplot2 object
References
Escofier B. and Pagès J., 2008, Analyses factorielles simples et multiples, Dunod.