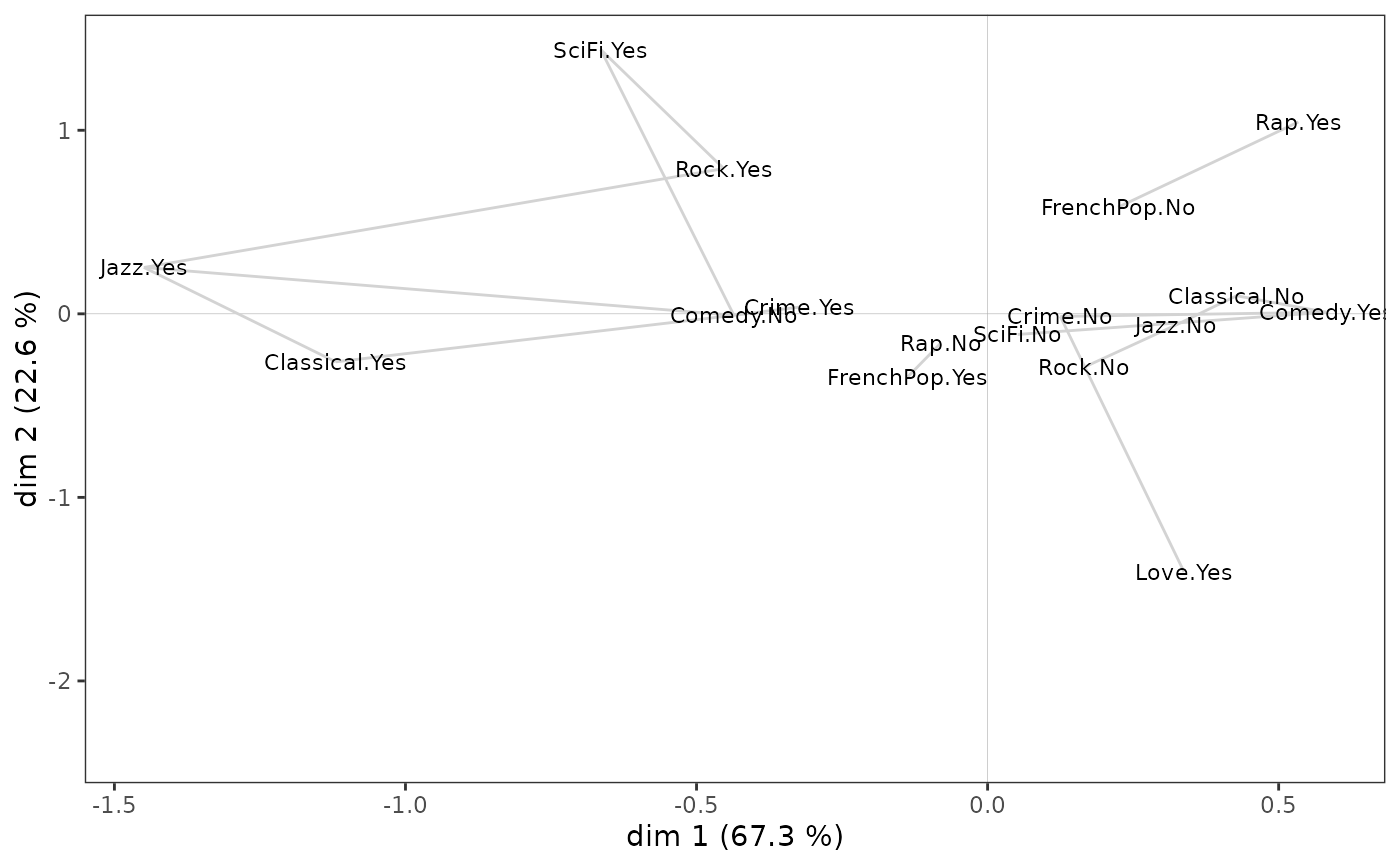
Plot of attractions between categories
ggadd_attractions.RdAdds attractions between categories, as measured by phi coefficients or percentages of maximum deviation (PEM), by plotting segments onto a MCA cloud of variables.
ggadd_attractions(p, resmca, axes = c(1,2), measure = "phi", min.asso = 0.3,
col.segment = "lightgray", col.text = "black", text.size = 3)
Arguments
- p
ggplot2object with the cloud of variables- resmca
object created with
MCA,speMCA,csMCA,wcMCA,bcMCA,stMCAormultiMCAfunction- axes
numeric vector of length 2, specifying the components (axes) to plot. Default is c(1,2).
- measure
character string. The measure for attractions: "phi" (default) for phi coefficients, "pem" for percentages of maximum deviation (PEM).
- min.asso
numerical value ranging from 0 to 1. The minimal attraction value for segments to be plotted. Default is 0.3.
- col.segment
Character string with the color of the segments. Default is lightgray.
- col.text
Character string with the color of the labels of the categories. Default is black.
- text.size
Size of the labels of categories. Default is 3.
Value
a ggplot2 object
References
Cibois, Philippe. Les méthodes d’analyse d’enquêtes. Nouvelle édition [en ligne]. Lyon: ENS Éditions, 2014. <http://books.openedition.org/enseditions/1443>
See also
Examples
# specific MCA on Taste example data set
data(Taste)
junk <- c("FrenchPop.NA", "Rap.NA", "Rock.NA", "Jazz.NA", "Classical.NA",
          "Comedy.NA", "Crime.NA", "Animation.NA", "SciFi.NA", "Love.NA",
          "Musical.NA")
mca <- speMCA(Taste[,1:11], excl = junk)
# Plots attractions
p <- ggcloud_variables(mca, col="white", legend="none")
ggadd_attractions(p, mca, measure="phi", min.asso=0.1)