Discriminant Analysis
DA.RdDescriptive discriminant analysis, aka "Analyse Factorielle Discriminante" for the French school of multivariate data analysis.
DA(data, class, row.w = NULL, type = "FR")Arguments
- data
data frame with only numeric variables
- class
factor specifying the class
- row.w
numeric vector of row weights. If NULL (default), a vector of 1 for uniform row weights is used.
- type
If "FR" (default), the inverse of the total covariance matrix is used as metric. If "GB", it is the inverse of the within-class covariance matrix (Mahalanobis metric), which makes the results equivalent to linear discriminant analysis as implemented in
ldafunction inMASSpackage.
Details
The results are the same with type "FR" or "GB", only the eigenvalues vary. With type="FR", these eigenvalues vary between 0 and 1 and can be interpreted as "discriminant power".
Value
An object of class PCA from FactoMineR package, with class as qualitative supplementary variable, and one additional item :
- cor_ratio
correlation ratios between
classand the discriminant factors
References
Bry X., 1996, Analyses factorielles multiples, Economica.
Lebart L., Morineau A. et Warwick K., 1984, Multivariate Descriptive Statistical Analysis, John Wiley and sons, New-York.)
Saporta G., 2006, Probabilités, analyses des données et statistique, Editions Technip.
Note
The code is adapted from a script from Marie Chavent. See: https://marie-chavent.perso.math.cnrs.fr/teaching/
Examples
library(FactoMineR)
data(decathlon)
points <- cut(decathlon$Points, c(7300, 7800, 8000, 8120, 8900), c("Q1","Q2","Q3","Q4"))
res <- DA(decathlon[,1:10], points)
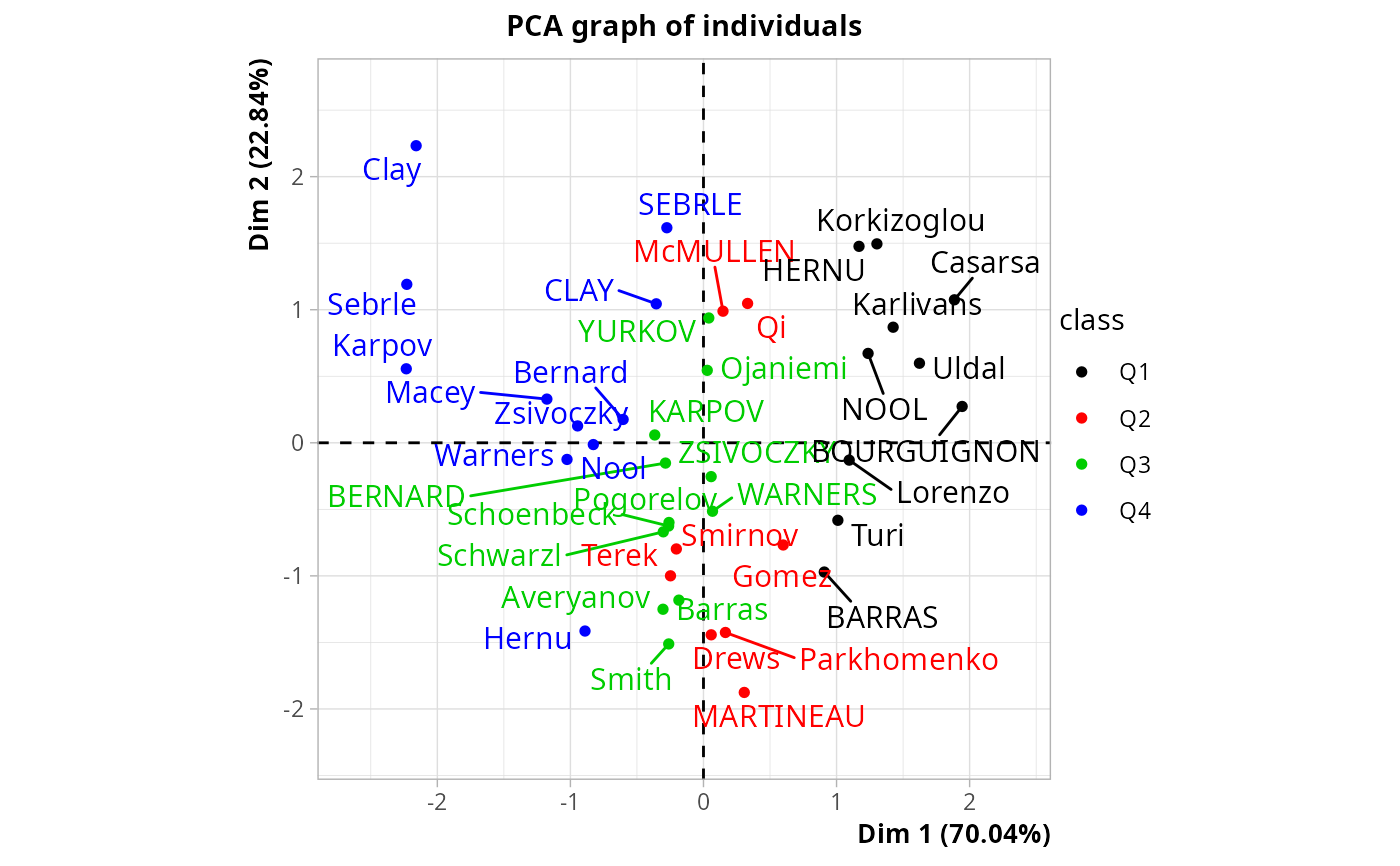
# plot of observations colored by class
plot(res, choix = "ind", invisible = "quali", habillage = res$call$quali.sup$numero)
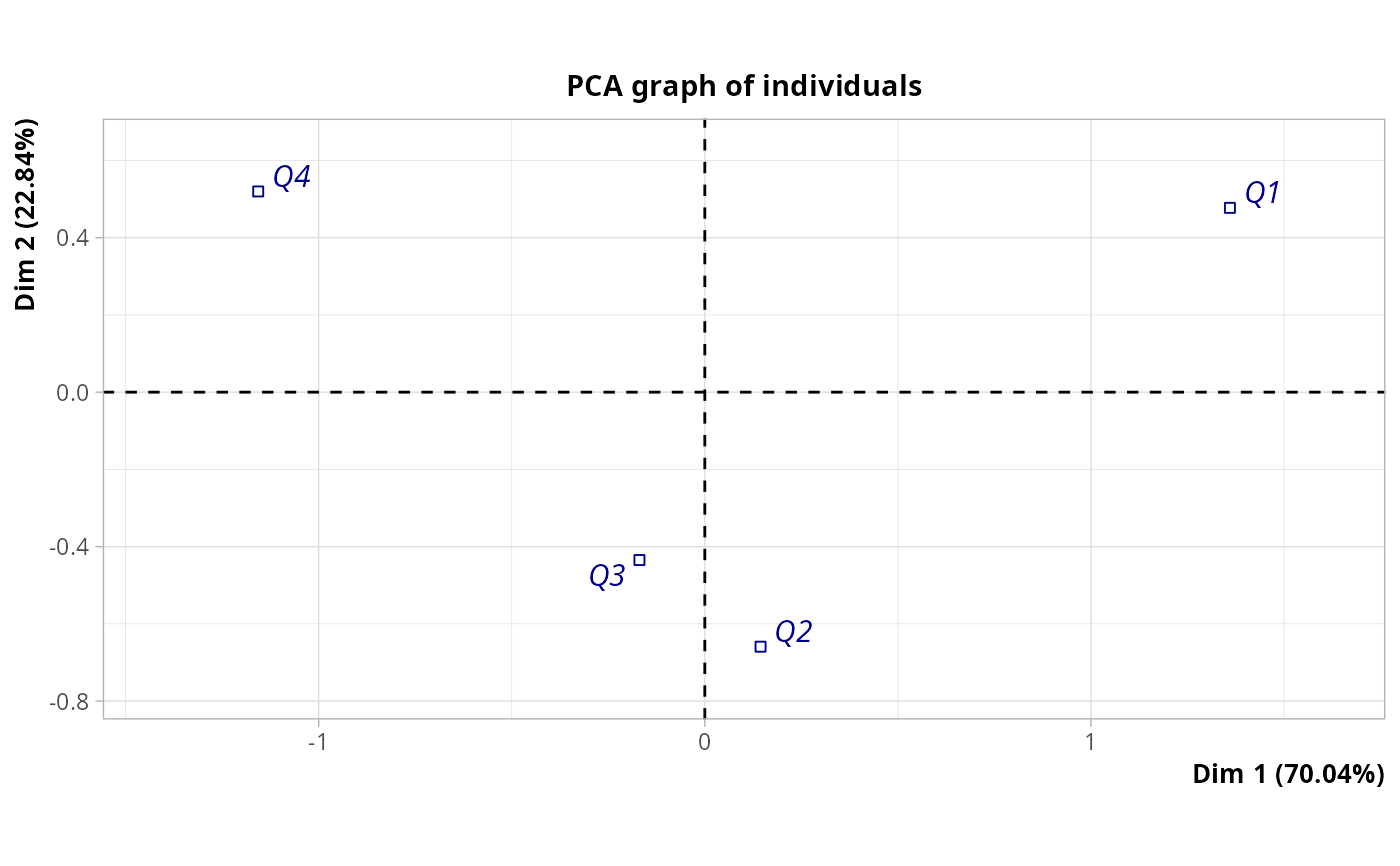
 # plot of class categories
plot(res, choix = "ind", invisible = "ind", col.quali = "darkblue")
# plot of class categories
plot(res, choix = "ind", invisible = "ind", col.quali = "darkblue")
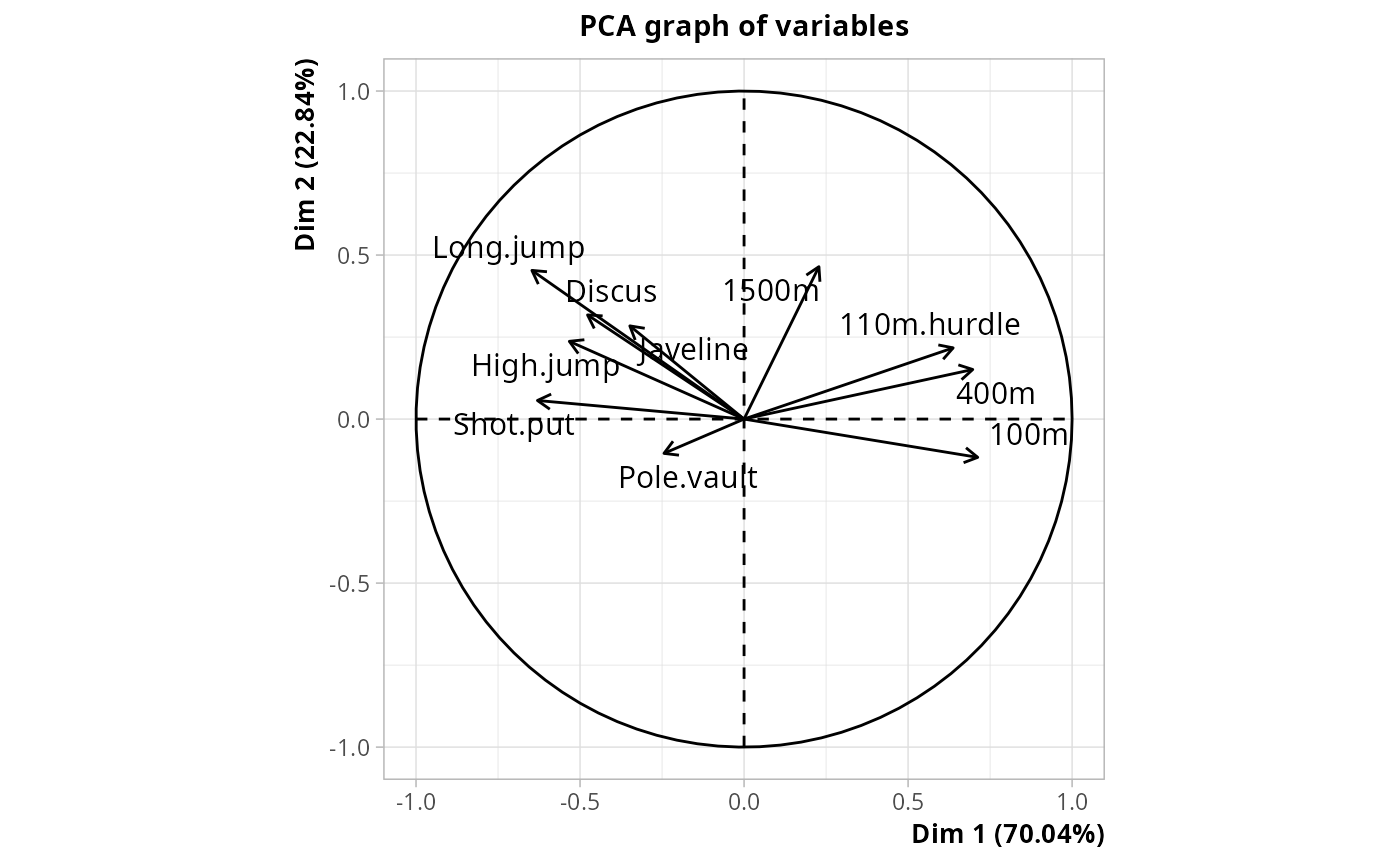
 # plot of variables
plot(res, choix = "varcor", invisible = "none")
# plot of variables
plot(res, choix = "varcor", invisible = "none")