Smoothing sequence data
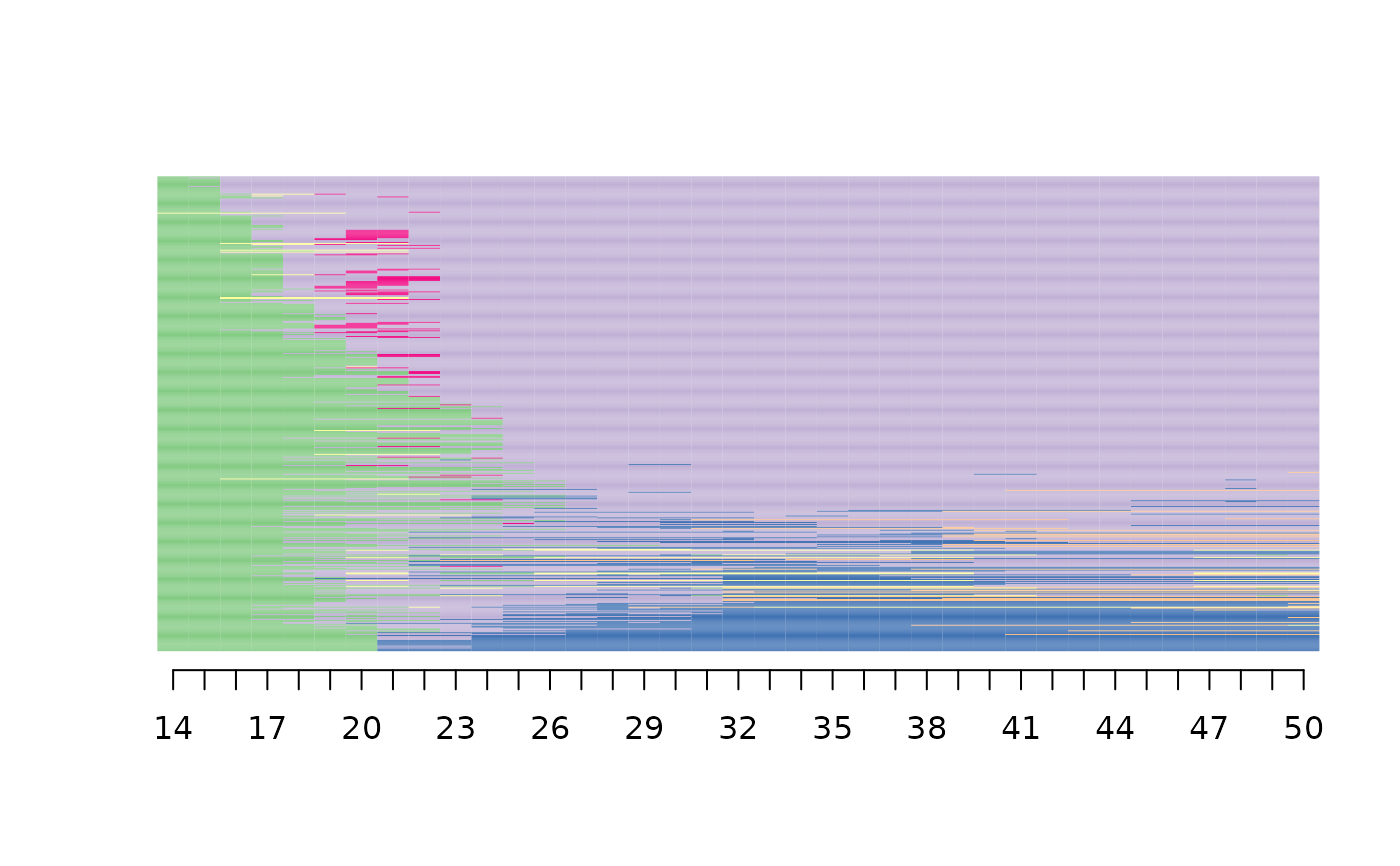
seqsmooth.RdSmoothing of sequence data, using for each sequence the medoid of the sequences in its neighborhood. The results can be used to get a smoothed index plot.
seqsmooth(seqdata, diss, k=20, r=NULL)Arguments
- seqdata
a sequence object (see
seqdeffunction).- diss
a dissimilarity matrix, giving the pairwise distances between sequences.
- k
size of the neighborhood. Default is 20.
- r
radius of the neighborhood. If NULL (default), the radius is not used for smoothing.
Value
A list with the following elements:
- seqdata
a sequence object (see
seqdeffunction)- R2
pseudo-R2 measure of the goodness of fit of the smoothing
- S2
stress measure of the goodness of fit of the smoothing
References
Piccarreta R. (2012). Graphical and Smoothing Techniques for Sequence Analysis, Sociological Methods and Research, Vol. 41(2), 362-380.
Examples
data(trajact)
seqact <- seqdef(trajact)
#>  [>] 6 distinct states appear in the data:
#>      1 = 1
#>      2 = 2
#>      3 = 3
#>      4 = 4
#>      5 = 5
#>      6 = 6
#>  [>] state coding:
#>        [alphabet]  [label]  [long label]
#>      1  1           1        1
#>      2  2           2        2
#>      3  3           3        3
#>      4  4           4        4
#>      5  5           5        5
#>      6  6           6        6
#>  [>] 500 sequences in the data set
#>  [>] min/max sequence length: 37/37
dissim <- seqdist(seqact, method="LCS")
#>  [>] 500 sequences with 6 distinct states
#>  [>] creating a 'sm' with a substitution cost of 2
#>  [>] creating 6x6 substitution-cost matrix using 2 as constant value
#>  [>] 377 distinct  sequences
#>  [>] min/max sequence lengths: 37/37
#>  [>] computing distances using the LCS metric
#>  [>] elapsed time: 0.584 secs
mds <- cmdscale(dissim, k=1)
smoothed <- seqsmooth(seqact, dissim, k=30)$seqdata
seqIplot(smoothed, sortv=mds, xtlab=14:50, with.legend=FALSE, yaxis=FALSE, ylab=NA)
