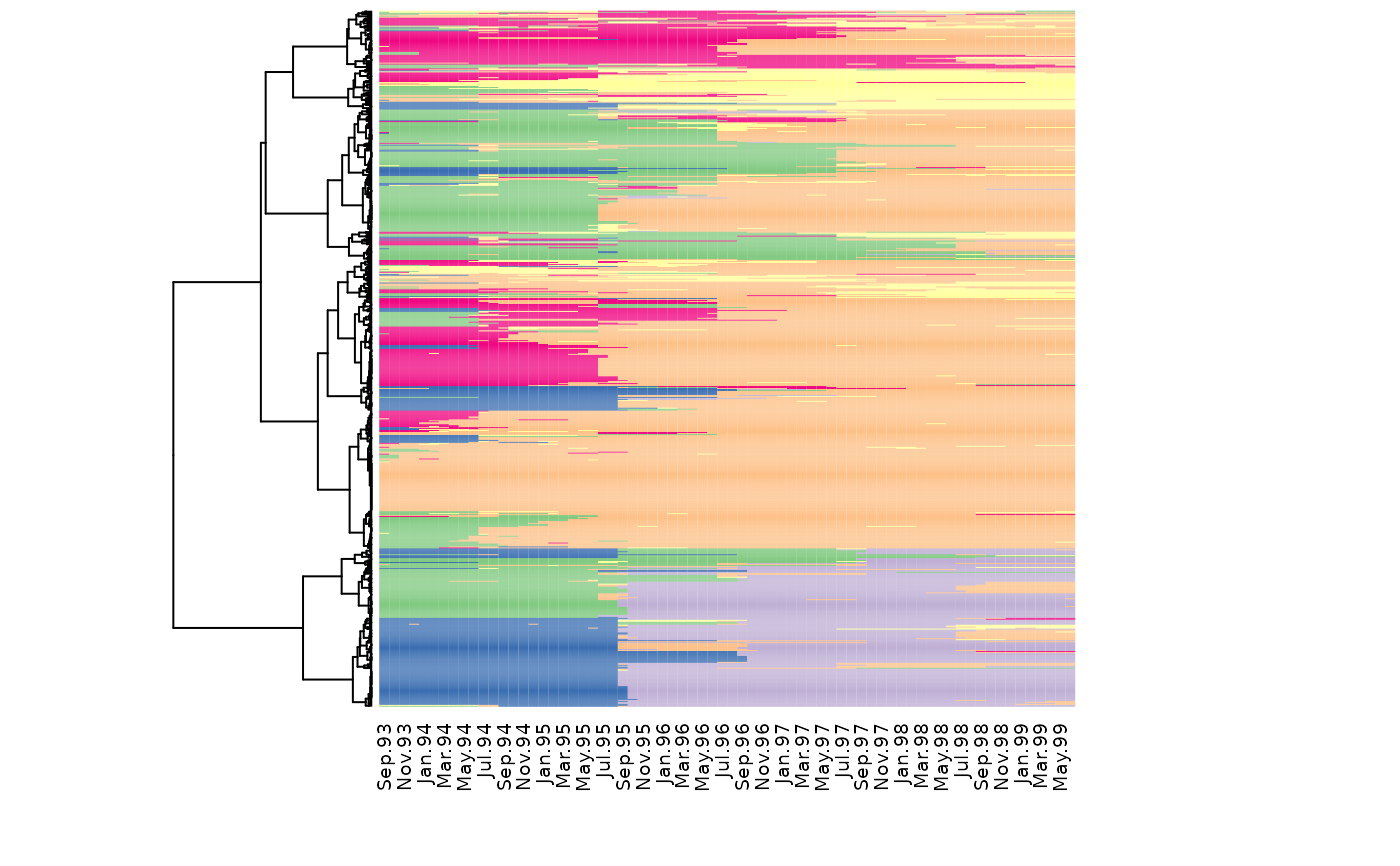
Index plot of sequences ordered according to a dendrogram
seq_heatmap.RdIndex plot of state sequences. Sequences are ordered according to the specified dendrogram. The dendrogram is also plotted on the side of the index plot.
seq_heatmap(seq, tree, with.missing = FALSE, ...)Arguments
- seq
a state sequence object created with the
seqdeffunction- tree
a dendrogram of the sequences (an object of class
hclust,dendrogramoragnes)- with.missing
is there a 'missing value' state in the sequences?
- ...
additional parameters sent to
heatmap
See also
Examples
if (require(TraMineR)) {
  data(mvad)
  mvad.seq <- seqdef(mvad[,17:86])
  mvad.lcs <- seqdist(mvad.seq, method = "LCS")
  mvad.hc <- hclust(as.dist(mvad.lcs), method = "ward.D2")
  seq_heatmap(mvad.seq, mvad.hc)
}
#>  [>] 6 distinct states appear in the data:
#>      1 = FE
#>      2 = HE
#>      3 = employment
#>      4 = joblessness
#>      5 = school
#>      6 = training
#>  [>] state coding:
#>        [alphabet]  [label]     [long label]
#>      1  FE          FE          FE
#>      2  HE          HE          HE
#>      3  employment  employment  employment
#>      4  joblessness joblessness joblessness
#>      5  school      school      school
#>      6  training    training    training
#>  [>] 712 sequences in the data set
#>  [>] min/max sequence length: 70/70
#>  [>] 712 sequences with 6 distinct states
#>  [>] creating a 'sm' with a substitution cost of 2
#>  [>] creating 6x6 substitution-cost matrix using 2 as constant value
#>  [>] 490 distinct  sequences
#>  [>] min/max sequence lengths: 70/70
#>  [>] computing distances using the LCS metric
#>  [>] elapsed time: 2.843 secs