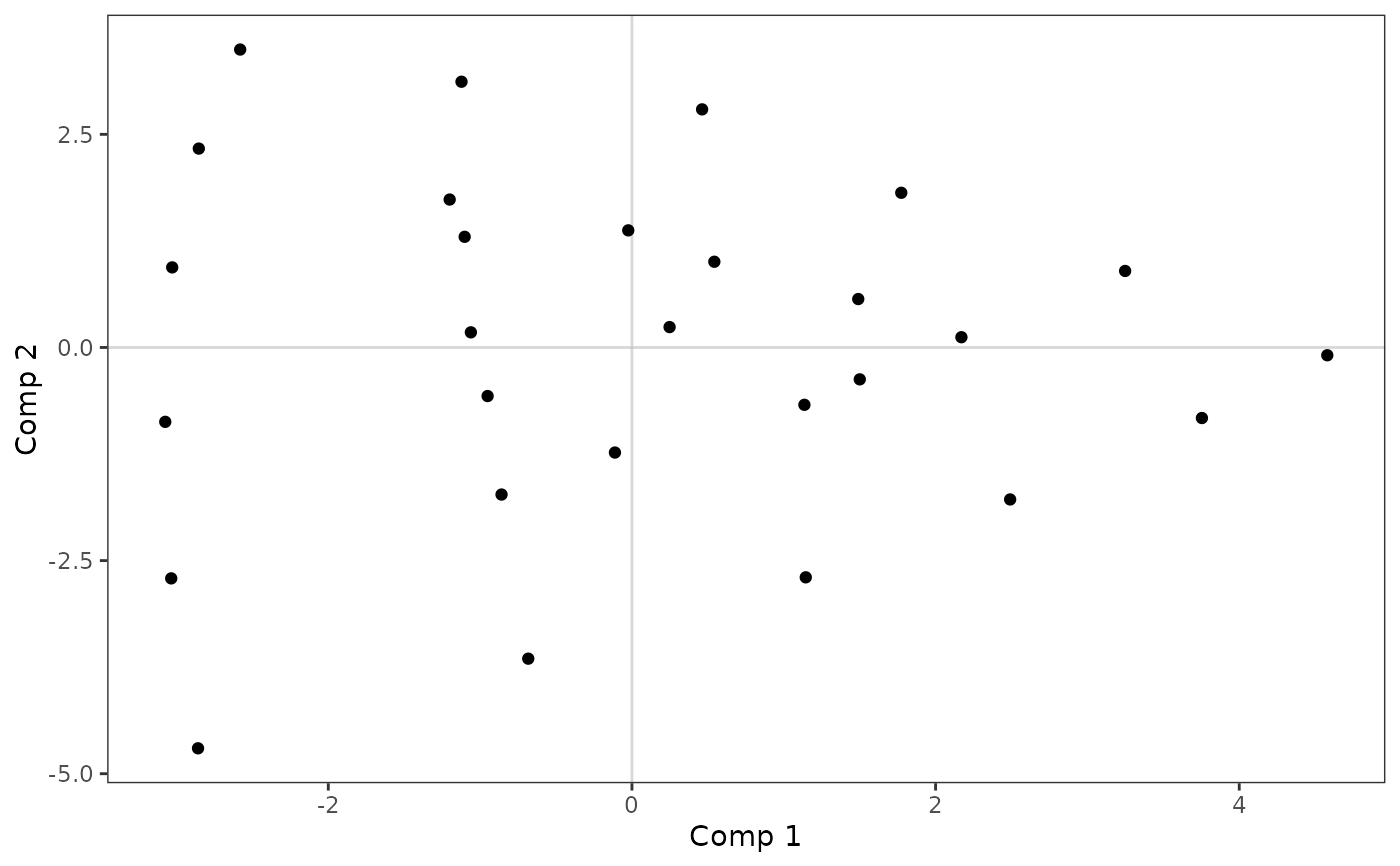
Plot of scores
plo_obs.RdPlots the scores of the observations of a PLS regression.
plo_obs(object, comps = 1:2, col = "black", size = 1.5)Arguments
- object
an object of class
mvrfromplspackage- comps
the components to use. Default is
c(1,2).- col
the color of the points.
- size
numerical value. The size of the points.
Value
a ggplot2 object
References
Martens, H., Næs, T. (1989) Multivariate calibration. Chichester: Wiley.
Tenenhaus, M. (1998) La Regression PLS. Theorie et Pratique. Editions TECHNIP, Paris.