Biplot for Nonsymmetric Correspondence Analysis
nsca.biplot.RdBiplot for Nonsymmetric correspondence analysis, for analysing contingency tables with a dependence structure
nsca.biplot(nsca, axes = c(1,2))Arguments
- nsca
an object of class
CAcreated bynsCA()function- axes
numeric vector of length 2, specifying the components (axes) to plot. Default is c(1,2).
Details
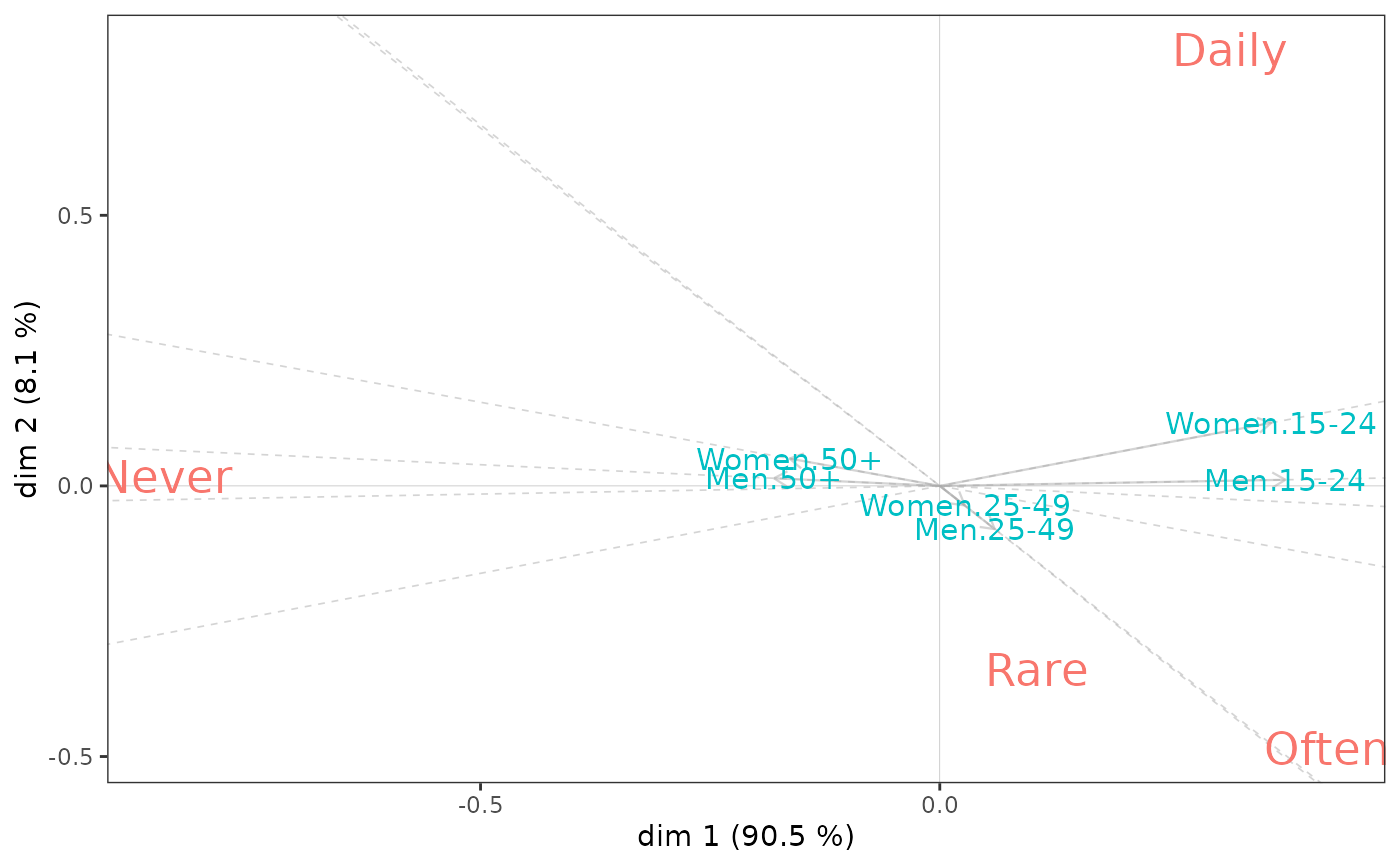
The biplots of an NSCA reflect the dependency structure of the contingency table and thus should not be interpreted as the planes of a standard CA. A first principle is that the graph displays the centred row profiles. A second principle is that the relationships between rows and columns are contained in their inner products : the rows are depicted as vectors, also called biplot axes, and the columns are projected on these vectors. If some columns have projections on the row vector far away from the origin, then the row has a comparatively large increase in predictability, and its profile deviates considerably from the marginal one, especially for that column.
For more detailed interpretational guidelines, see Kroonenberg and Lombardo (1999, pp.377-378).
Value
a ggplot2 object
References
Kroonenberg P.M. and Lombardo R., 1999, "Nonsymmetric Correspondence Analysis: A Tool for Analysing Contingency Tables with a Dependence Structure", Multivariate Behavioral Research, 34 (3), 367-396.
See also
Examples
data(Music)
# The combination of Gender and Age is the predictor variable
# "Focused" listening to music is the response variable
tab <- with(Music, table(interaction(Gender, Age), OnlyMus))
nsca <- nsCA(tab)
nsca.biplot(nsca)

# Goodman and Kruskal tau
nsca$GK.tau
#> [1] 0.05991598
# Goodman and Kruskal tau
nsca$GK.tau
#> [1] 0.05991598