Plot of variables on a single axis
ggaxis_variables.RdPlots variables on a single axis of a Multiple Correspondence Analysis. Variables can be active or supplementary.
ggaxis_variables(resmca, var = NULL, axis = 1,
min.ctr = NULL, prop = NULL,
underline = FALSE, col = NULL, vlab = TRUE,
force = 1, max.overlaps = Inf)
Arguments
- resmca
object created with
MCA,speMCA,csMCA,wcMCA,bcMCA,stMCAormultiMCAfunction- var
If NULL (default), all the active variables of the MCA are plotted. If a character string, the named active variables of the MCA is plotted. If a factor, it is plotted as a supplementary variable.
- axis
numeric value. The MCA axis to plot. Default is 1.
- min.ctr
If NULL (default), all the categories are displayed. If "best", only the categories that contribute more than the average (i.e. 100 / number of categories) are displayed. If a numerical value between 0 and 100, only categories that contribute more than
min.ctrare displayed.- prop
If NULL (default), the size of the labels is constant. If "freq", the size is proportional to the weights of categories. If "ctr", it's proportional to the contributions of categories (only used for active variables). If "cos2", it's proportional to the squared cosines of the categories. If "pval", it's proportional to 1 minus the p-values of typicality tests (only used for supplementary variables). If "cor", it's proportional to the point biserial correlation of the categories (only used for supplementary variables).
- underline
logical. If TRUE, the labels of the categories with contributions above average are underlined. Default is FALSE. Only used for active variables.
- col
character string. Color name for the labels of the categories. If NULL and
var=NULL, the default palette ofggplot2is used, with one color per variable. If NULL andvaris not NULL, labels are black.- vlab
Logical. Should the variable names be used as a prefix for the labels of the categories. Default is TRUE.
- force
Force of repulsion between overlapping text labels. Defaults to 1. If 0, labels are not repelled at all.
- max.overlaps
Exclude text labels that overlap too many things. Defaults to Inf, which means no labels are excluded.
Value
a ggplot2 object
References
Le Roux B. and Rouanet H., Multiple Correspondence Analysis, SAGE, Series: Quantitative Applications in the Social Sciences, Volume 163, CA:Thousand Oaks (2010).
Le Roux B. and Rouanet H., Geometric Data Analysis: From Correspondence Analysis to Stuctured Data Analysis, Kluwer Academic Publishers, Dordrecht (June 2004).
See also
Examples
# specific MCA of Taste example data set
data(Taste)
junk <- c("FrenchPop.NA", "Rap.NA", "Rock.NA", "Jazz.NA", "Classical.NA",
"Comedy.NA", "Crime.NA", "Animation.NA", "SciFi.NA", "Love.NA",
"Musical.NA")
mca <- speMCA(Taste[,1:11], excl = junk)
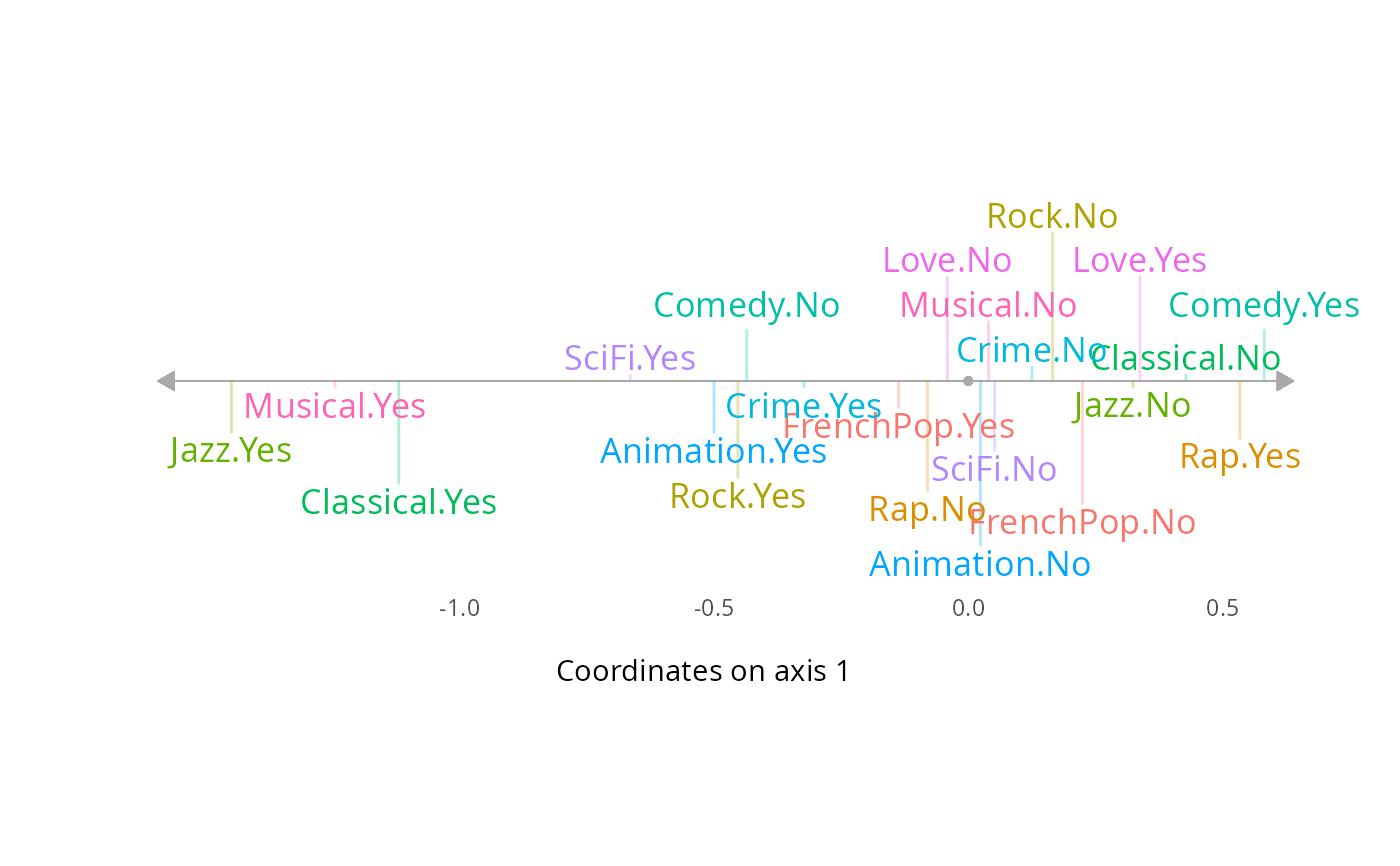
# plots all the active categories on axis 1
ggaxis_variables(mca)
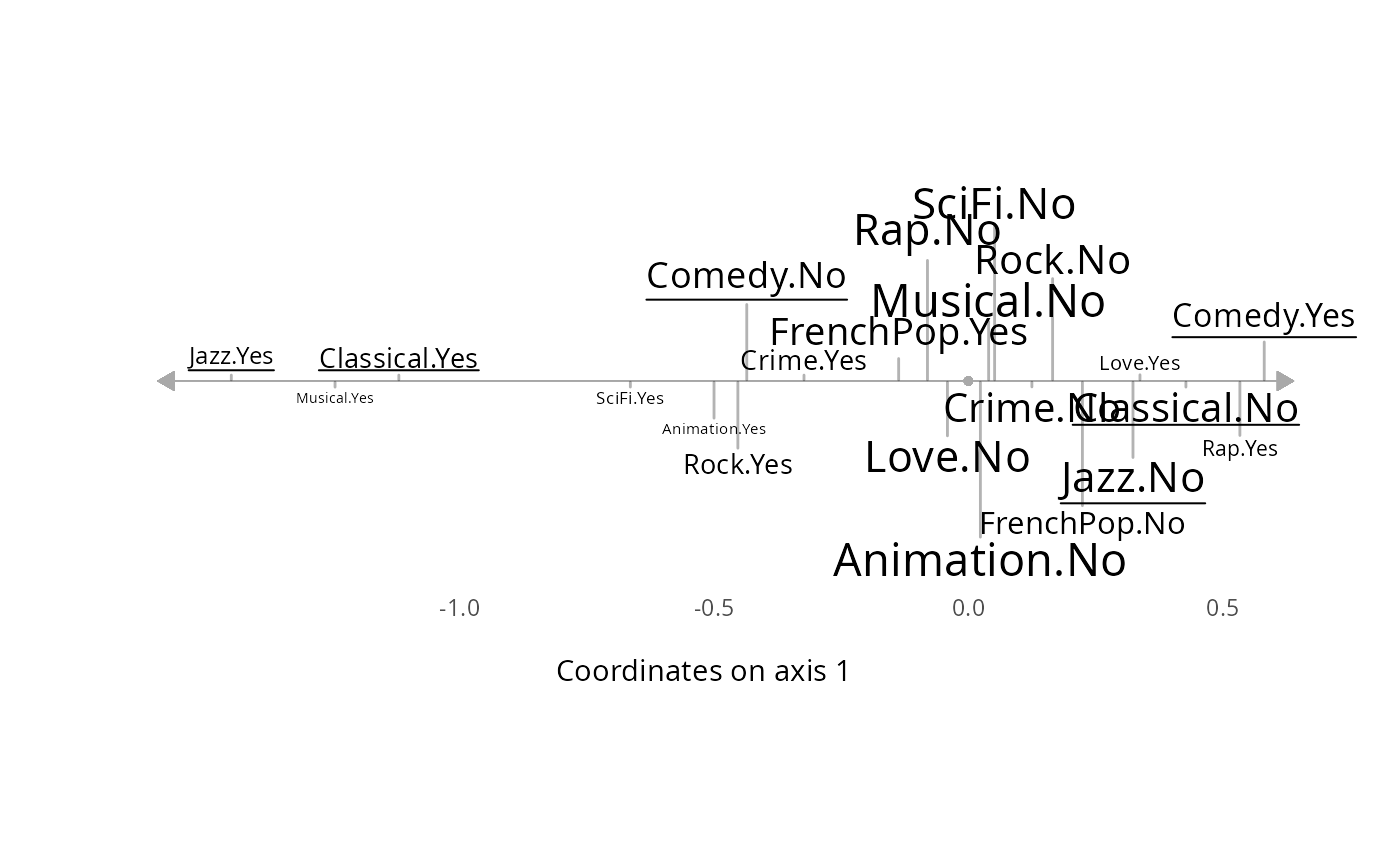
 # the same with other plotting options
ggaxis_variables(mca, prop = "freq", underline = TRUE, col = "black")
# the same with other plotting options
ggaxis_variables(mca, prop = "freq", underline = TRUE, col = "black")
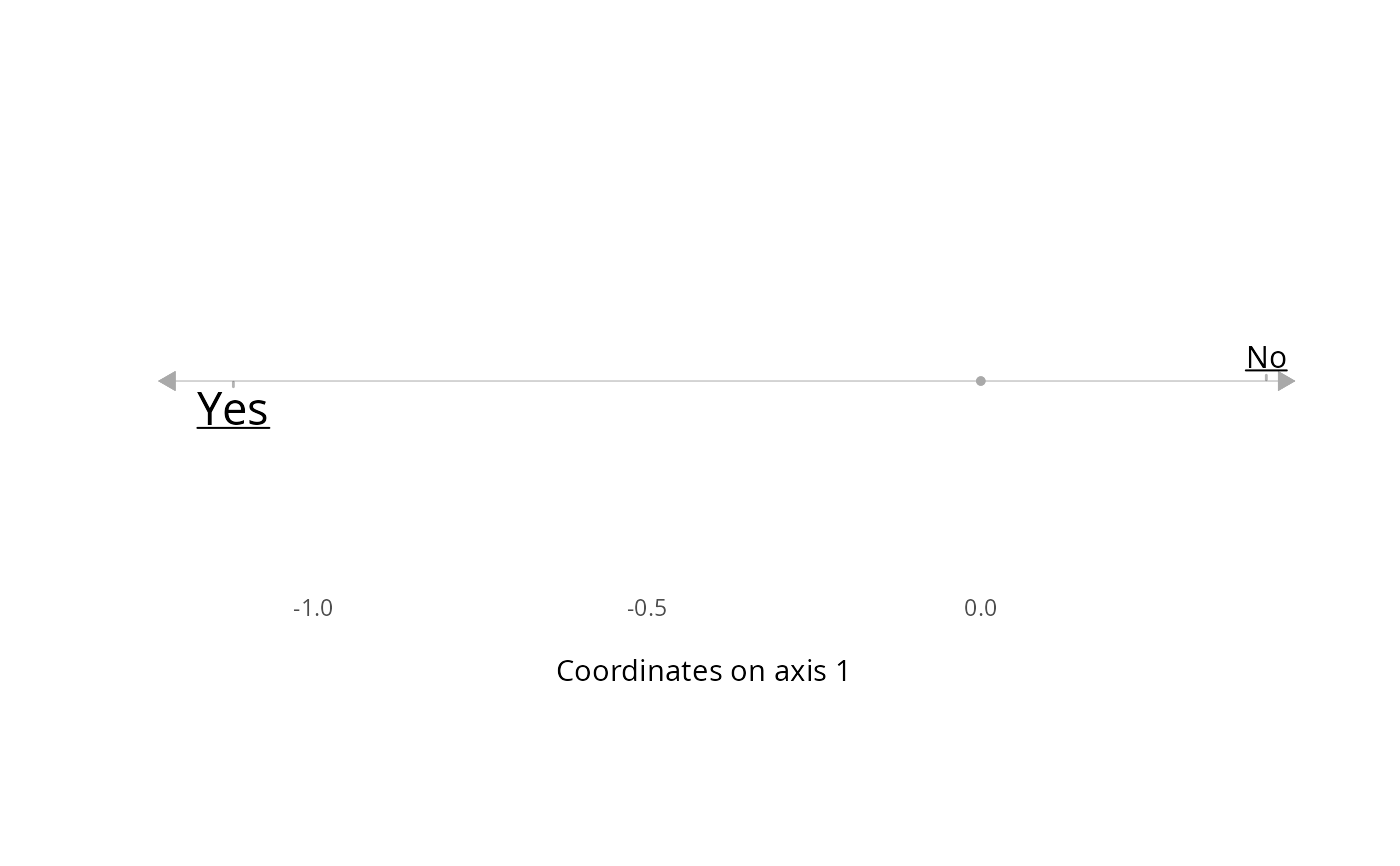
 # plots Active variable Classical on axis 1
ggaxis_variables(mca, var = "Classical", axis = 1, prop = "ctr", underline = TRUE)
# plots Active variable Classical on axis 1
ggaxis_variables(mca, var = "Classical", axis = 1, prop = "ctr", underline = TRUE)
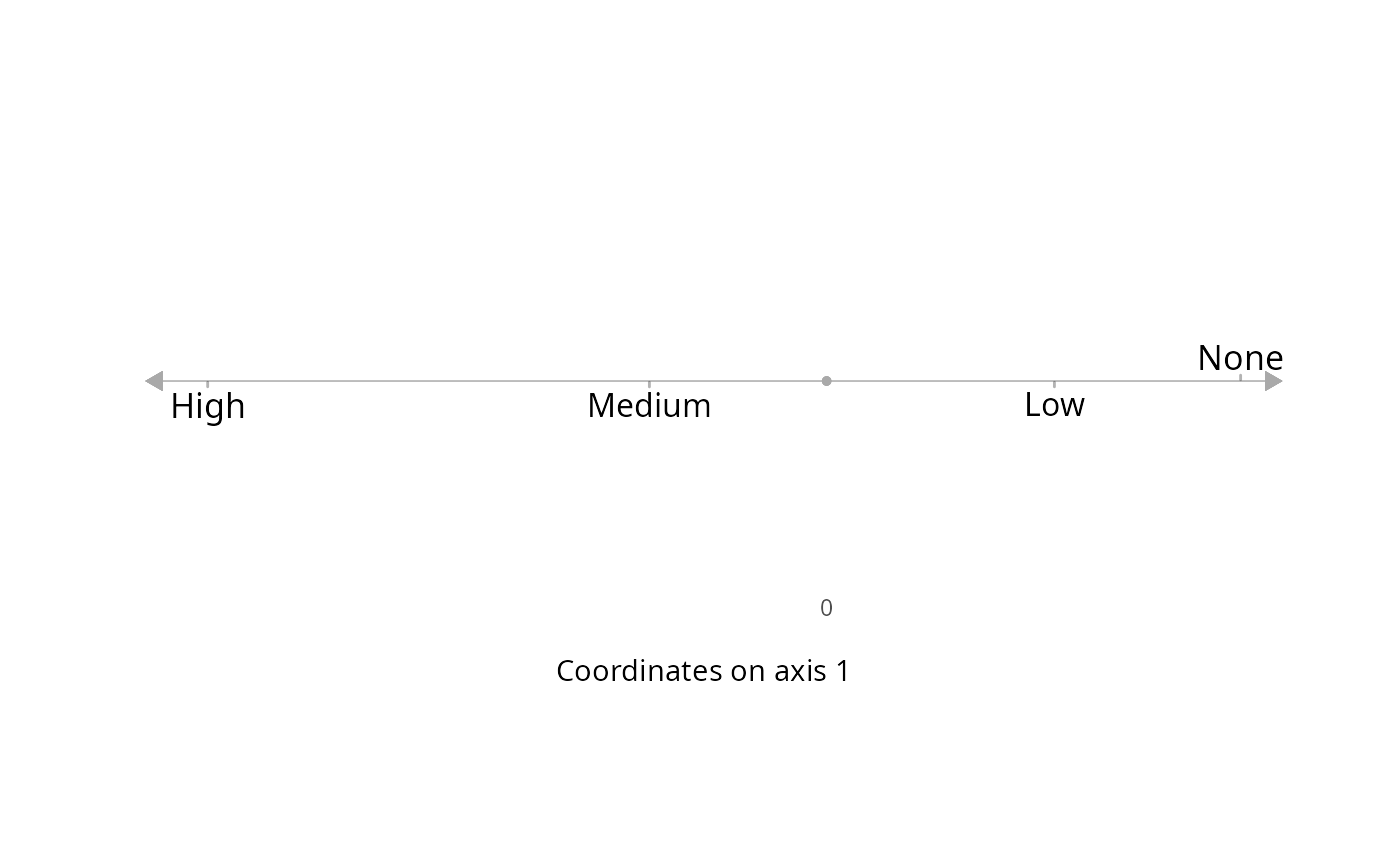
 # plots supplementary variable Educ on axis 1
ggaxis_variables(mca, var = Taste$Educ, axis = 1, prop = "pval")
# plots supplementary variable Educ on axis 1
ggaxis_variables(mca, var = Taste$Educ, axis = 1, prop = "pval")