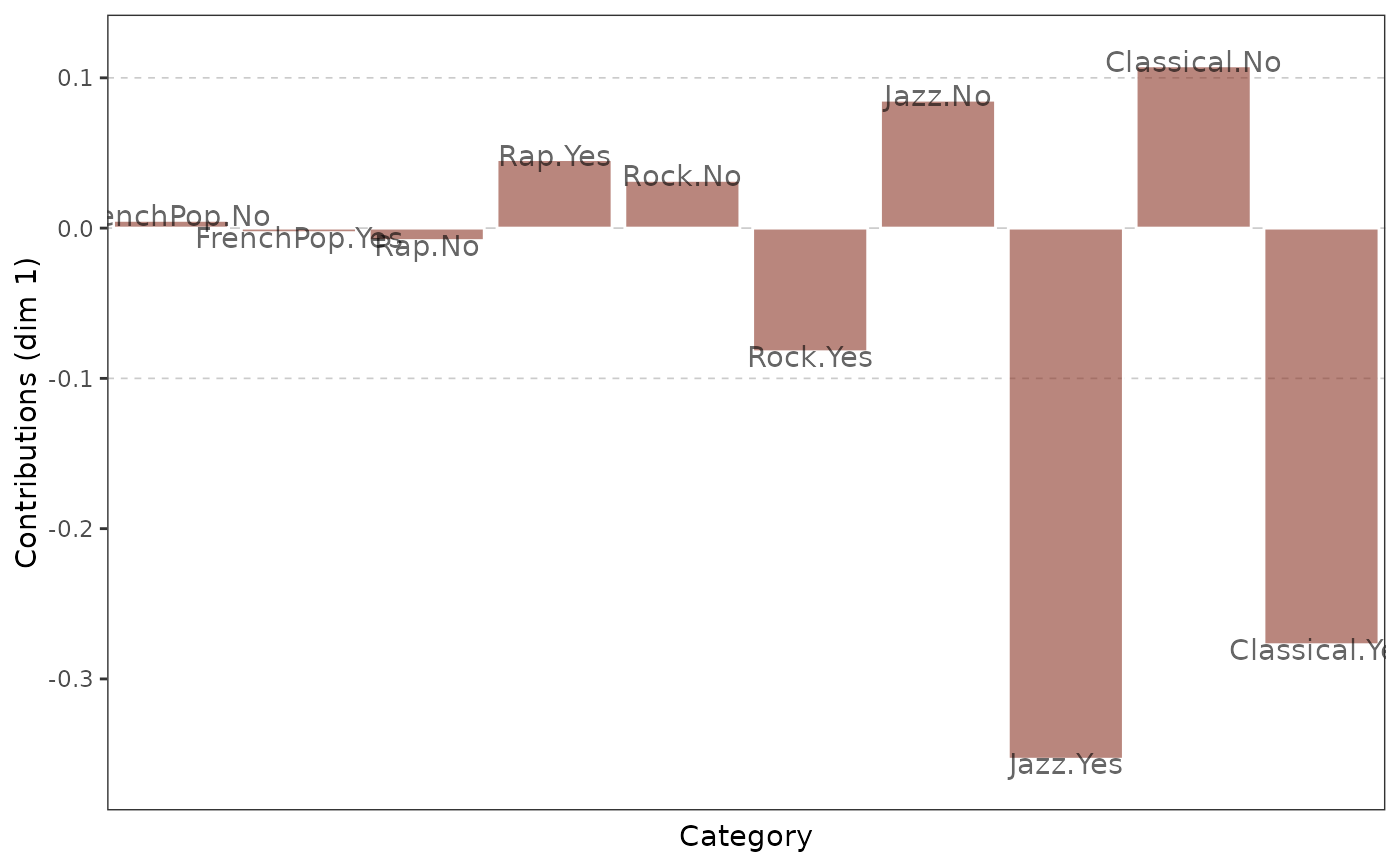
Bar plot of contributions
barplot_contrib.RdFrom MCA results, plots contributions to the axes.
barplot_contrib(resmca, dim = 1, which = "var",
  sort = FALSE, col = "tomato4", repel = FALSE)
Arguments
- resmca
object created with
MCA,speMCA,csMCA,wcMCA,bcMCA,stMCAormultiMCAfunction- dim
the dimension to use. Default is 1.
- which
If
resmcais of classMCA,speMCA,csMCAorPCA, should be"var"to plot contributions of variables or"ind"to plot contributions of individuals. Ifresmcais of classCA, should be"row"to plot contributions of rows or"col"to plot contributions of columns. Default is"var".- sort
logical. If
TRUE, bars are sorted by decreasing VIPs. Default isFALSE.- col
color of the bars
- repel
logical. If
TRUE, the names of the variables are repelled withgeom_text_repel. Default isFALSE
Details
The contributions are multiplied by the sign of the coordinates, so that the plot shows on which side of the axis they contribute, which makes the interpretation easier.
Value
a ggplot2 object
References
Le Roux B. and Rouanet H., Multiple Correspondence Analysis, SAGE, Series: Quantitative Applications in the Social Sciences, Volume 163, CA:Thousand Oaks (2010).
Le Roux B. and Rouanet H., Geometric Data Analysis: From Correspondence Analysis to Stuctured Data Analysis, Kluwer Academic Publishers, Dordrecht (June 2004).