Plots for Ascending Hierarchical Clustering
ahc.plots.RdDraws various plots for Ascending Hierarchical Clustering results.
ahc.plots(ahc, distance = NULL, max.cl = 20, type = "dist")Arguments
- ahc
object of class
hclustoragnes- distance
A dissimilarity matrix or a
distobject. Only used iftypeis "inert" or "loss". Default is NULL.- max.cl
Integer. Maximum number of clusters taken into account in the plots.
- type
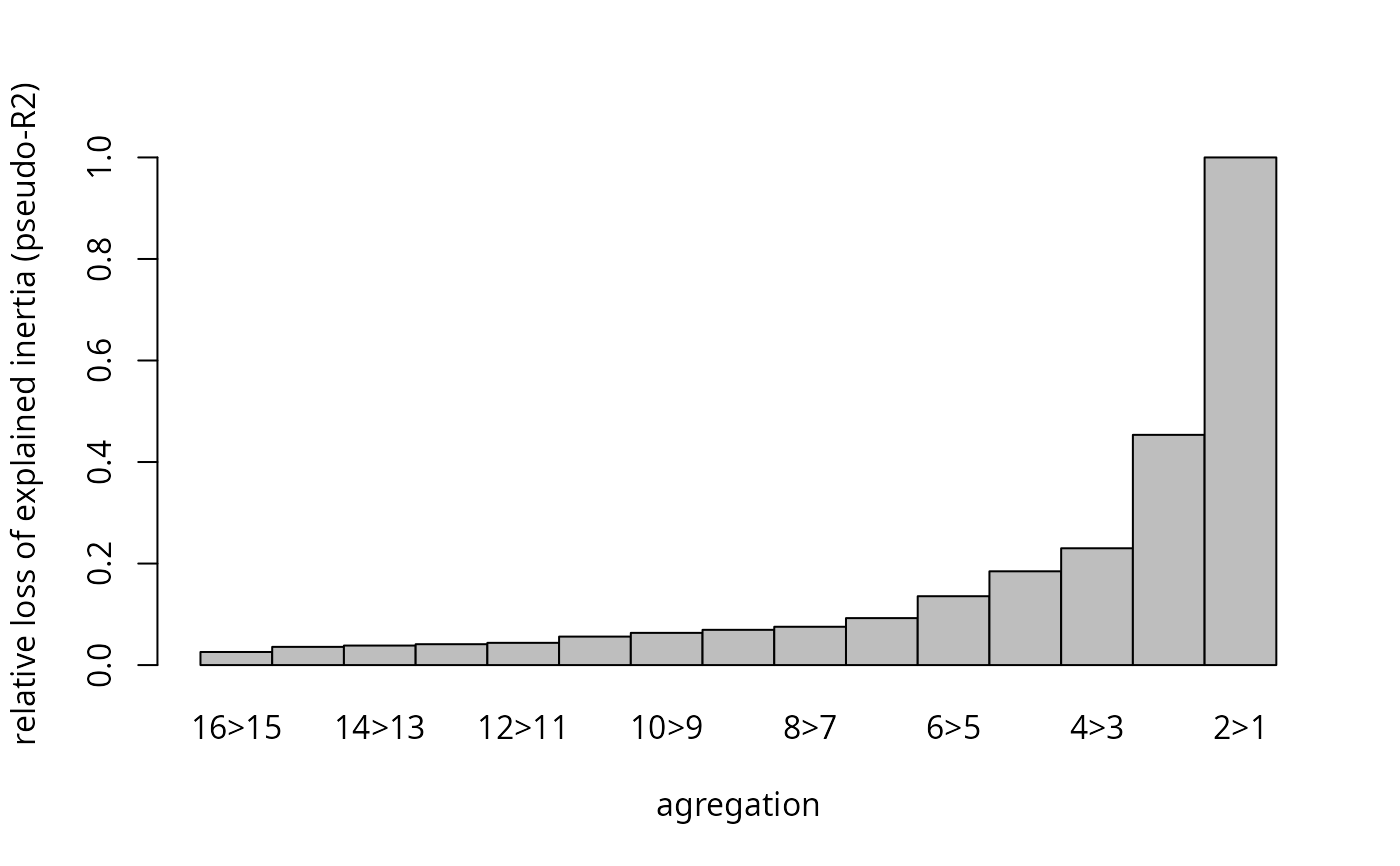
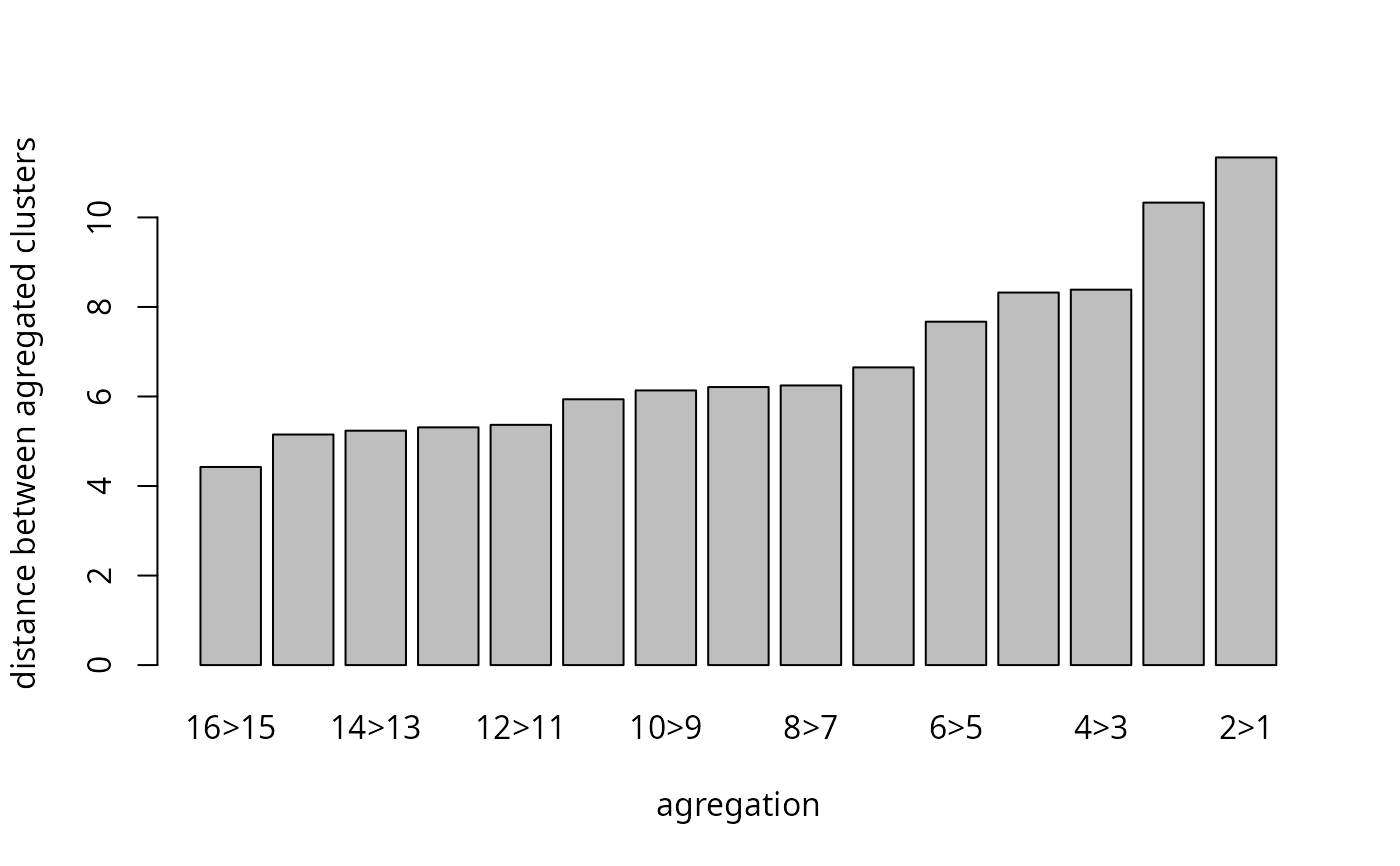
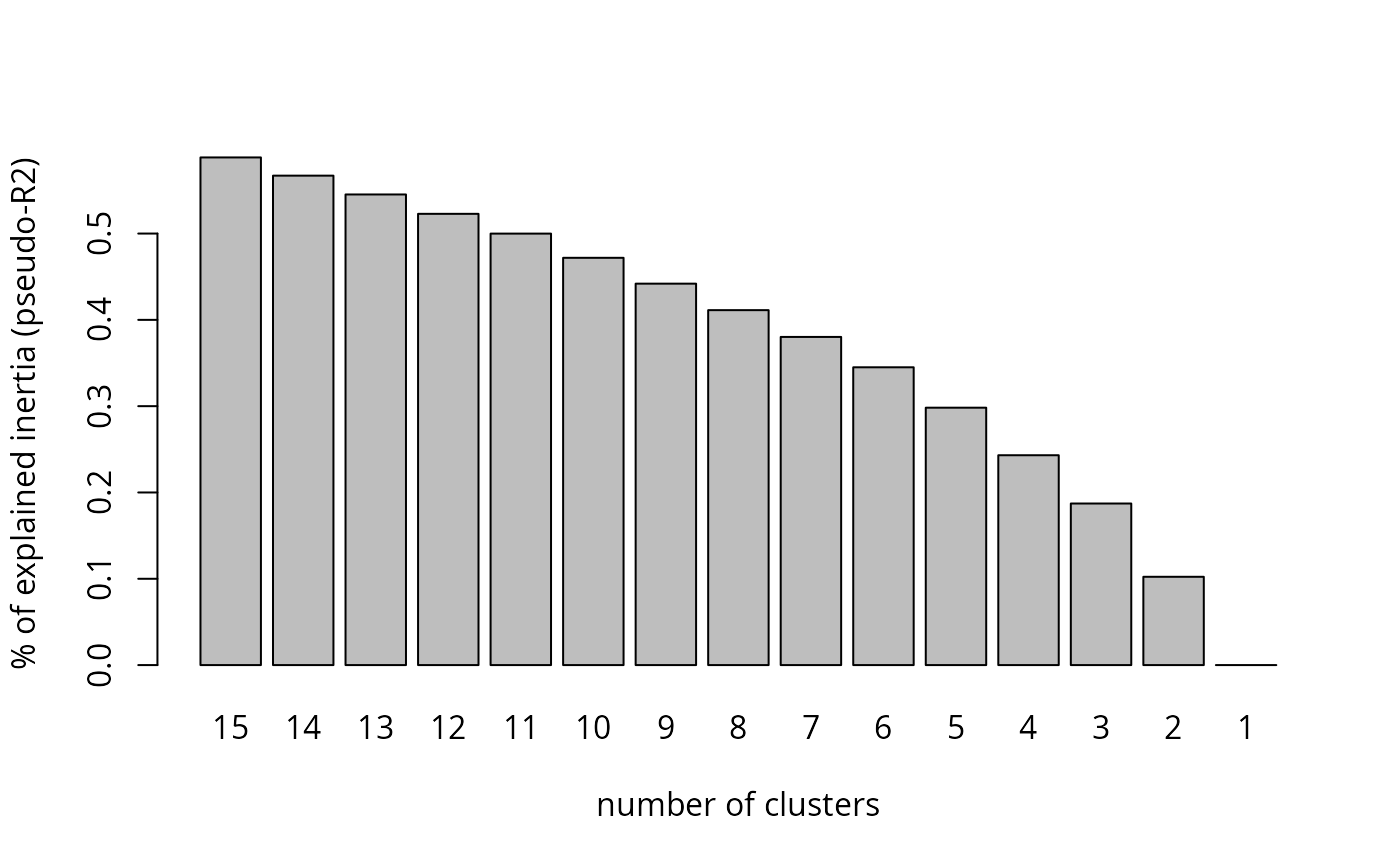
Character string. If "dist" (default), the distance between agregated clusters is plotted. If "inert", it is the percentage of explained inertia (pseudo-R2). If "loss", it is the relative loss of explained inertia (pseudo-R2).
Details
The three kinds of plots proposed with this function are aimed at guiding in the choice of the number of clusters.
See also
Examples
data(Taste)
# clustering of a subsample of the data
disjonctif <- dichotom(Taste[1:200, 1:11])
distance <- dist(disjonctif)
cah <- stats::hclust(distance, method = "ward.D2")
# distance between aggregated clusters
ahc.plots(cah, max.cl = 15, type = "dist")
 # percentage of explained inertia
ahc.plots(cah, distance = distance, max.cl = 15, type = "inert")
# percentage of explained inertia
ahc.plots(cah, distance = distance, max.cl = 15, type = "inert")
 # relative loss of explained inertia
ahc.plots(cah, distance = distance, max.cl = 15, type = "loss")
# relative loss of explained inertia
ahc.plots(cah, distance = distance, max.cl = 15, type = "loss")